The report is where a test tells you what is happening. It shows how many people saw each version, what they did, how much money each version made, and how likely each one is to be the best.
Where to find it:

AiX Optimize, Tests, then the test name or Report. The Dashboard's Running now and Recent winners link to it too.
The top of the report:
The header shows the test name, its status (Running, Paused, Draft or Ended) and an Autopilot badge when that mode is on. The line under it gives the kind of test, the page, the goal, what it is scored by, and the start date with the days running.
The buttons:
- Pause and End test while it runs, Start when it is a draft or paused, Run again when it has ended.
- Edit opens the builder.
- CSV downloads the results (see below).
- Reset results sets every number back to zero. The versions themselves are kept.
The five cards:
- Visitors: everyone counted in the test, all versions together.
- Conversions: everything that counted as the goal.
- Sales: sales from all versions.
- Net revenue: sales less money given back.
- The last card shows the leading version and its probability of being the best, for example 98.9% with Next weekend is best underneath.
The versions table:

One row per version. The leader has a Leader badge, and a declared winner has a trophy.
- Visitors: people who saw this version.
- Conversions: goals reached.
- Conv. rate: conversions divided by visitors. The small range under it is the 95% credible interval: where the true rate most likely sits, given the data so far.
- Leads and Sales: counted for every test, whatever the goal.
- Revenue: the value of the sales.
- Refunded: money given back on this version's sales, with how many.
- Net: revenue less refunded.
- Rev / visitor: net divided by visitors.
- Lift: how much better or worse than the Original on the scoring measure. Green is better, red is worse.
- P(best): the probability this version is the best one (see below).
- Time: average seconds on the page.
- Scroll: average deepest scroll, as a percentage of the page.
- Bounce: the share of visitors who left within 5 seconds, scrolled less than 20% and clicked nothing.
- Rage: rage clicks, with dead clicks beside them.
- Preview opens the live page as that version. Heat opens the click heatmap for that version only. Declare winner shows while the test runs.
What P(best) means:
The plugin takes the numbers so far and simulates 3,000 possible outcomes. P(best) is the share of them in which this version comes out on top. 95% means that in 95 of 100 likely worlds, this version wins. When the test is scored by revenue per visitor, the order value counts as well as the conversion rate.
Last 30 days:
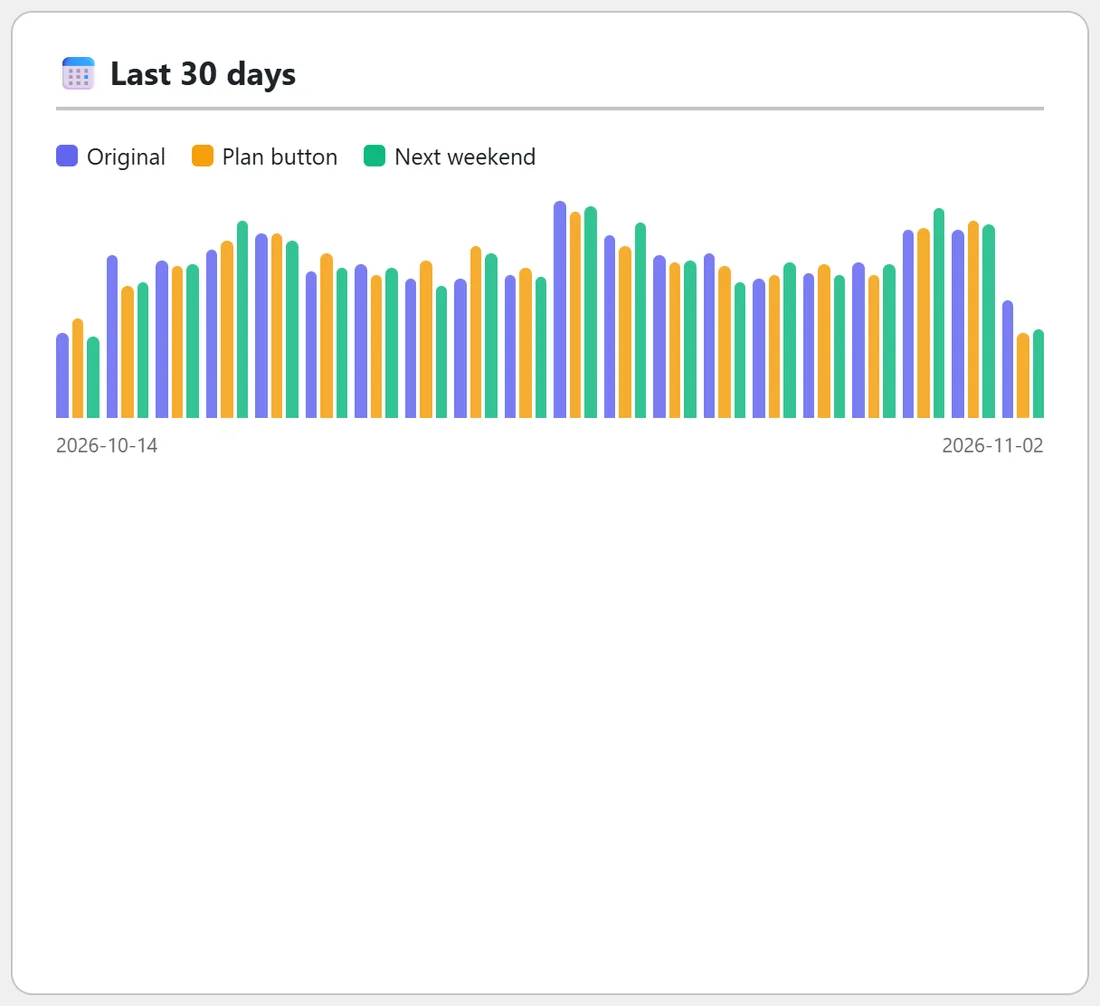
A bar chart of daily visitors, one colour per version, with a key above it. Hover a bar to see the version, its visitors and its conversions for that day.
By device and source:
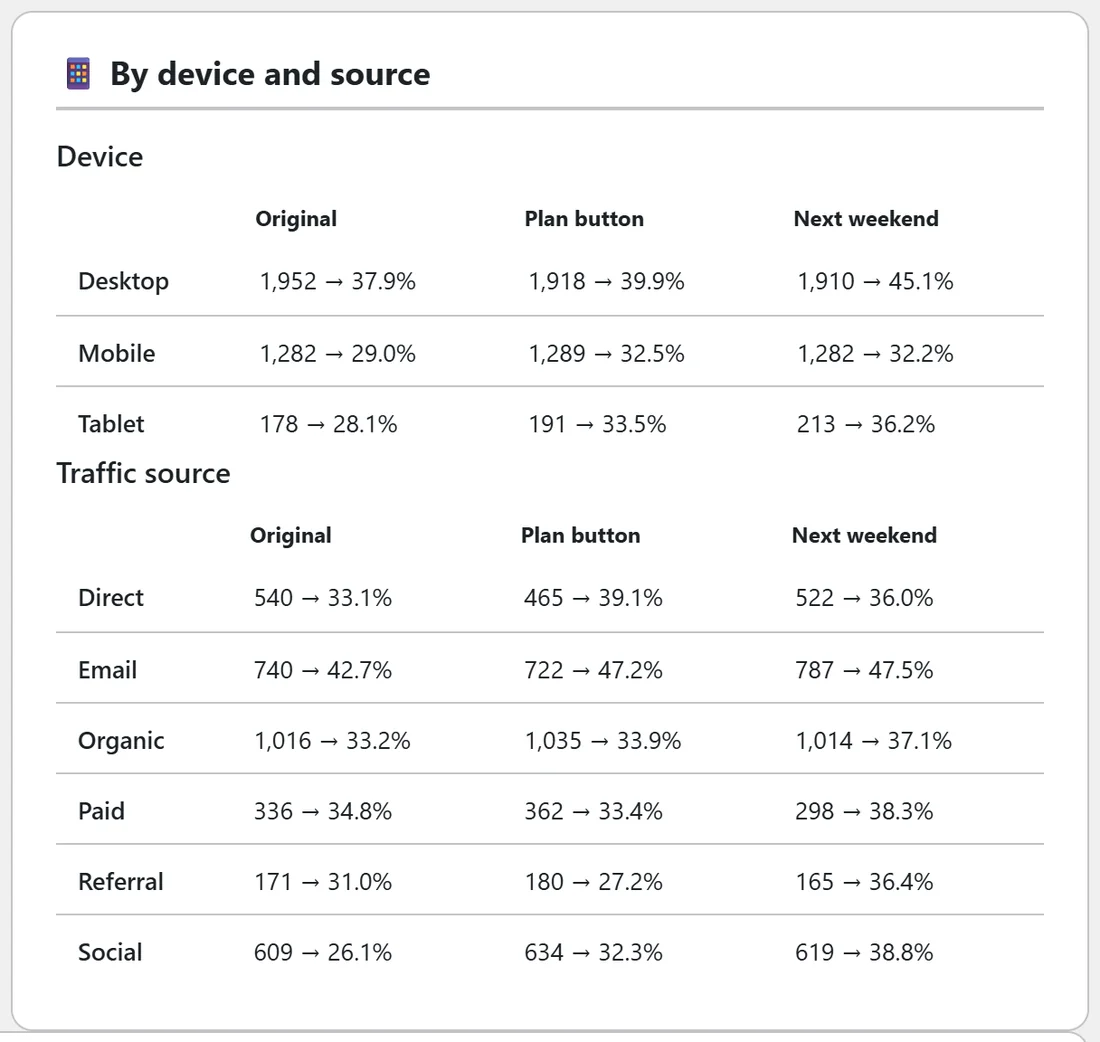
Two tables, Device and Traffic source. Each cell shows a version's visitors, then its conversion rate, and the revenue under it when there were sales. The sources are paid, email, social, organic, referral and direct, worked out from utm tags and the site the visitor came from. A version that wins on mobile and loses on desktop is a different decision from one that wins everywhere.
In plain English and What each version changes:
In plain English holds the AI's reading of the report when an AI key is connected. See AI Features: Challenger Copy, Report Explanations And Test Ideas With Your Own Key. What each version changes lists every change, the page shown, or the address visitors are sent to, version by version.
The CSV file:
CSV downloads one file with a row per version (visitors, conversions, conversion rate, leads, sales, revenue, refunded, net, revenue per visitor, lift, probability best, average seconds, average scroll, bounce, clicks, rage clicks and dead clicks), then a row per day and version with visitors and conversions.
A real example:
The Starter guide: headline and button test at Yoursite Bakery School has run 19 days. The cards show 10,215 visitors and 3,762 conversions. In the table, the Original turned 34.03% of its visitors into guide requests, Plan button 36.76% and Next weekend 39.71%, a lift of 16.7% on the Original. Time and scroll are close for all three, so the headline and button did the work. By device shows Next weekend well ahead on desktop, while on mobile Plan button and Next weekend are almost level, a good reason to watch a few mobile replays.
Tips:
- Read Is it ready to call? before the table. A big lift on a young test can still be luck. See How A Winner Is Called: Ready, Too Early To Call And Confidence.
- Click Heat on each row to see why a version won: where its visitors clicked and how far they read.
- You and other logged-in editors are not counted, so use Preview freely.