Everything in ResultsAiX Optimize lives under one menu, with one row of tabs. This article walks through each tab so you know where everything is.
Where to find it:
WordPress menu, AiX Optimize. The sidebar also has shortcuts straight to Dashboard, Analytics, Tests, Heatmaps, Replays, Your sites, Conversions and New Test.
The tab bar:

The tabs are Dashboard, Analytics, Tests, Heatmaps, Replays, Your sites, Conversions, AI, Training, Resources, Settings and Diagnostics, with a New Test button at the end. When the ResultsAiX Hub is installed, a Hub tab appears too. The test builder and the test report open under the Tests tab.
Dashboard:

Your overview. The six numbers at the top are:
- Tests running: tests that are live right now.
- Tested visitors (30d): visitors counted in any test over the last 30 days.
- Conversions (30d): leads, sales and goals counted in tests over the last 30 days.
- Net revenue in tests (30d): sales counted in tests, less money given back.
- Pages with heat data: pages that have collected heatmap data.
- Replays stored: session replays kept right now.
Under them:
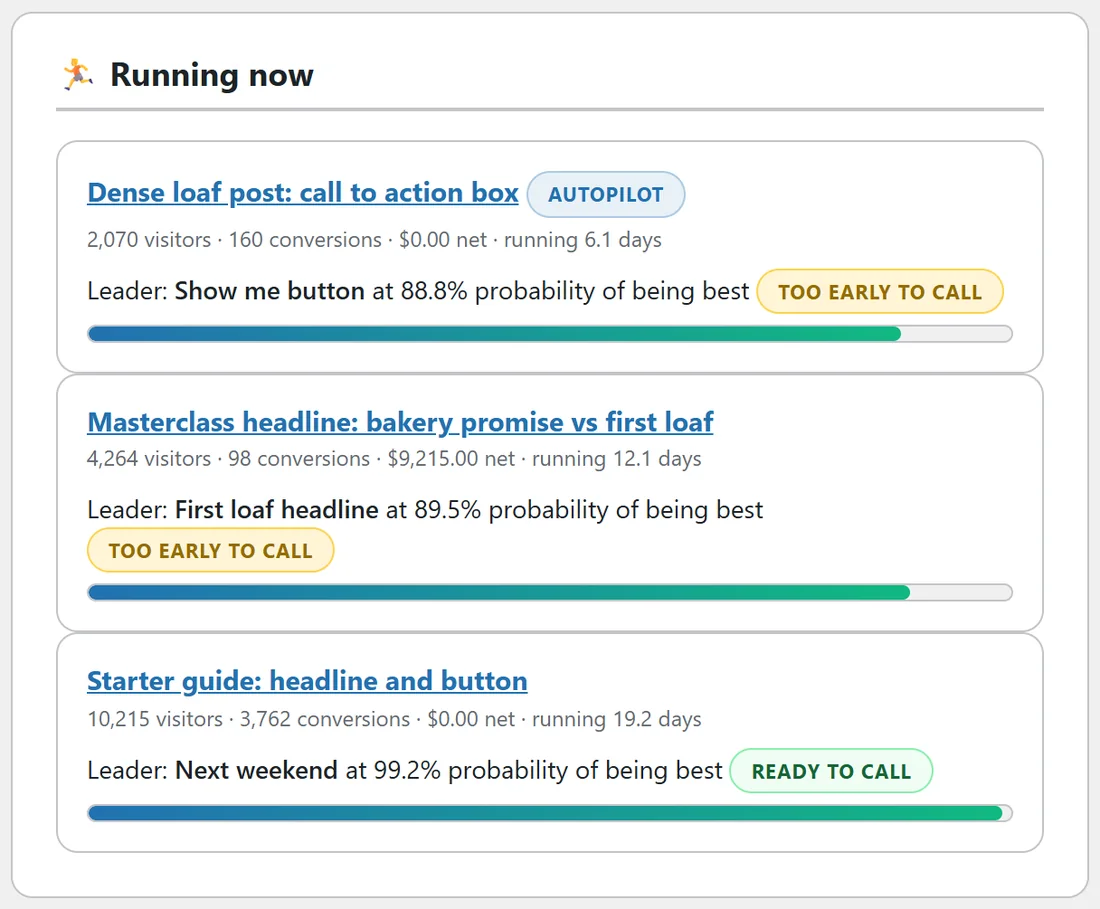
- Running now: each running test with its visitors, conversions, net revenue and days running, the current leader with its probability of being best, and a too early to call or ready to call badge. Click a test name to open its report.
- Recent winners: the last five ended tests, with the winning version and why it won. Winner live for everyone shows when the winner is still being shown.
- Busiest pages: the pages with the most recent heat data, with visitors, clicks and a Heatmap button.
- What to test next: pick a page and press Suggest tests for AI test ideas. This needs an AI key on the AI tab.
On a brand new site the Dashboard opens with a welcome panel and two buttons, Create your first test and Two-minute training.
Analytics:
Every page view on this site and your other sites, followed to the Buy click and the sale: six numbers against the period before, a daily chart, the visit to sale funnel, an AI read, the tests running now, a table of your pages, and your sources, devices and campaigns. See Analytics: Visitors, Buy Clicks And Sales For Every Page.
Tests:
Every test, with filters for All, Running, Paused, Drafts and Ended. Each row has quick actions: Report, Edit, Pause, End, Start or Run again, Heatmap, Duplicate and Delete. With an AI key connected, Build a test with AI sits at the top. See The Tests List: Filters, Statuses And Quick Actions.
Heatmaps:
Every page people visit, on this site and every site with the one line of code, as a card with its picture, views, average scroll, Buy clicks, sales and frustrated clicks. View heatmap opens the heatmap viewer inside the dashboard. See Heatmaps: Click Maps, Mouse Maps, Scroll Maps And Attention Maps and The Heatmap Viewer, Dead Clicks And Rage Clicks.
Replays:
Recorded visits with filters for All, Converted, Rage clicks, Mobile and Starred, and a Watch button on each. See Session Replays: Watching How Real Visitors Use A Page.
Your sites:
The one line of code that brings any page on any site into Optimize, a Check button for any page, the sites allowed to use it, and what counts as a Buy click. See Using Optimize On Any Page Of Any Site (The One Line Of Code).
Conversions:
Every way Optimize counts a lead or a sale: the thank-you page line, the shortcode, the postback address for checkouts, and the latest conversions counted. See Counting Leads And Sales On Any Checkout (Conversions).
AI:
Connect your own Google Gemini, Claude or OpenAI key, or use the one already saved in your ResultsAiX theme or Mailer. Pick a model and a fallback, set a soft monthly budget and see every AI job with its cost. See AI Features: Challenger Copy, Report Explanations And Test Ideas With Your Own Key.
Training:
The whole manual on one page inside the plugin: quick start, the kinds of test, the editor, goals, how the winner is chosen, Autopilot, heatmaps, replays, connections, AI, caching, privacy and troubleshooting.
Resources:
Other ResultsAiX tools that work alongside this one.
Settings:
Your licence, help links, the colour scheme, tracking, replay and privacy settings, the weekly email report, and the Danger Zone. See The Settings Tab: Tracking, Replays, Privacy And Appearance.
Diagnostics:
A health report of the plugin and your server, with Copy Report for Support. See Diagnostics: The Health Report For Support.
A real example:
On Monday morning the owner of Yoursite Bakery School opens the Dashboard. Running now shows the guide page test marked ready to call, so she opens its report and declares the winner. Then she opens Analytics, sorts Your pages by revenue, clicks Heatmap on the Masterclass page and sees which part of the page people never reach.
Tip:
Bookmark the Dashboard. It answers the three daily questions: what is running, what has won, and which page to look at next. Open Analytics once a week for the bigger picture, or let the weekly email bring it to you.