The Stats tab is the report you would build in a big analytics tool, except it knows who your visitors are, what they have spent with you, and what your ads cost. And next to anybody who is online right now there is a button to talk to them. Everything is worked out from the visits Pulse already keeps on your own site.
Where to find it:
WordPress menu, ResultsAiX Pulse, 📈 Stats. The Dashboard's See the full Stats button opens it too.
How Pulse counts:
- A visit is one browser's page views with no gap longer than 30 minutes.
- A person is one email address with all its browsers, or one browser nobody knows yet.
- A channel is how a visit arrived: the utm tags on its first page first, then the site it came from.
- Each lead and sale belongs to the last visit of the same person before it, up to 30 days back.
- Your own browsers and email addresses are never counted.
The filters and the headline numbers:
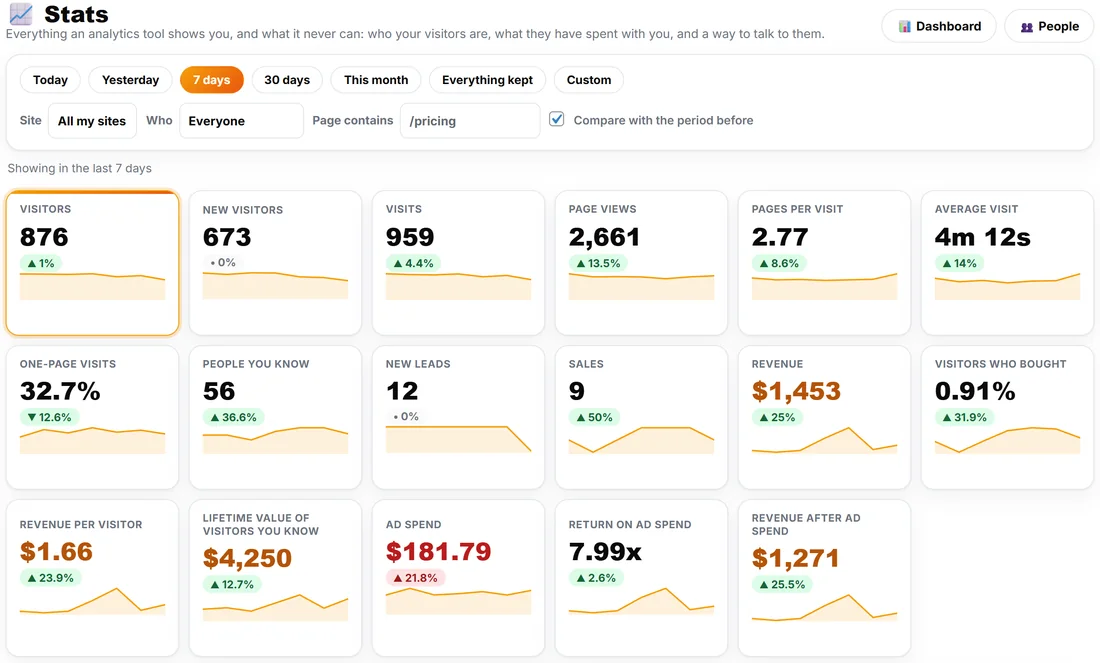
- Pick a range: Today, Yesterday, 7 days, 30 days, This month, Everything kept, or Custom with two dates.
- Pick a Site, or leave All my sites.
- Who narrows it to a kind of visitor, for example people you know, new or returning visitors, or customers.
- Page contains narrows it to visits that include a page, for example /pricing.
- Compare with the period before is ticked by default.
The headline numbers are Visitors, New visitors, Visits, Page views, Pages per visit, Average visit, One-page visits, People you know, New leads, Sales, Revenue, Visitors who bought, Revenue per visitor and Lifetime value of visitors you know. Each has its change against the period before and a small line chart. Hover a number to read what it means.
When your ads report what they cost, three more appear: Ad spend, Return on ad spend (revenue for every $1 of spend) and Revenue after ad spend. Spend comes from WP Conversion Tracker (the cost per click you set on a tracking link, times its clicks) and from ResultsAiX ADs (what Google and Meta report). Ad spend covers the whole period and is not split by the filters.
The big chart and Right now:
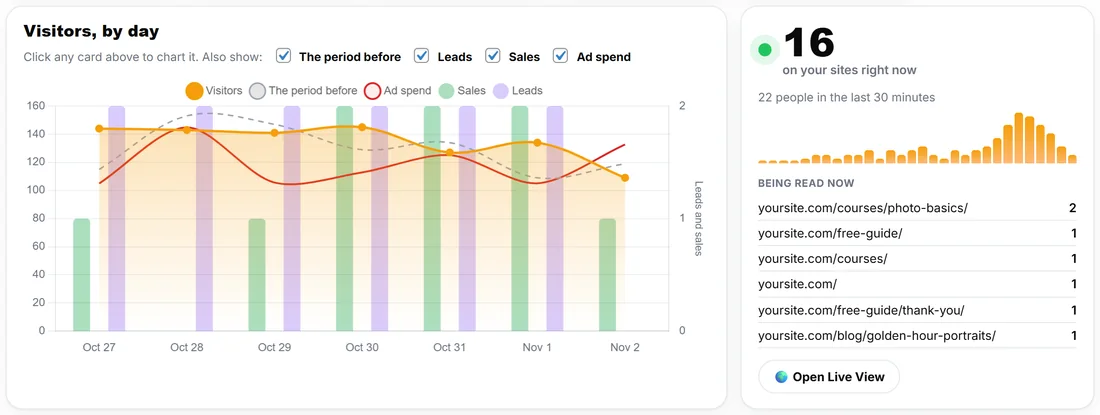
Click any headline number and the big chart shows it day by day, with the period before as a dashed line. Tick boxes switch the extra lines on and off: The period before, Ad spend, Leads and Sales. Beside it, Right now shows how many people are on your sites this minute, the pages they are reading, and an Open Live View button.
What stands out:
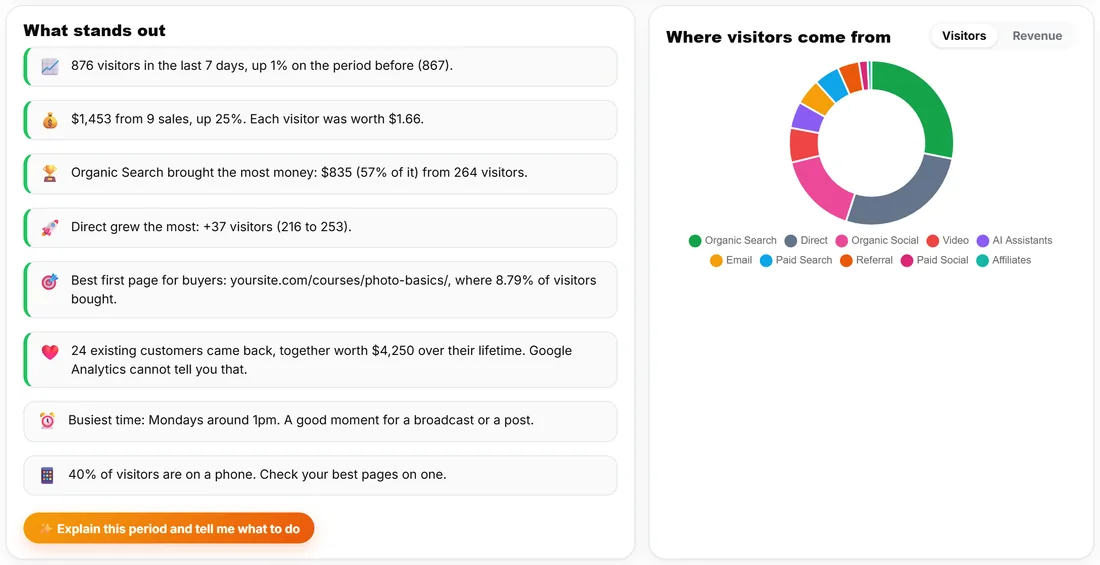
Plain sentences about the period: visitors and revenue against the period before, the channel that brought the most money, what grew the most, the best first page for buyers, how many existing customers came back, and the busiest time of the week. Under them, ✨ Explain this period and tell me what to do asks your assistant to write what happened, what is working and three things to do next, using only the numbers on the screen. It needs an AI key on the AI Assistant tab.
Where visitors come from shows the same channels as a ring, by visitors or by revenue.
How people find you:
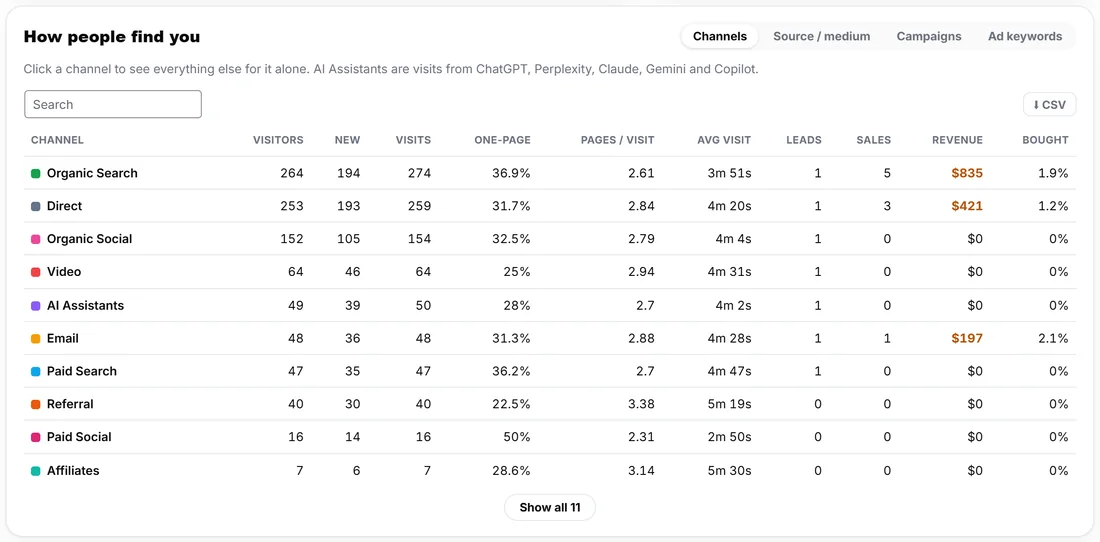
The table lists each channel with Visitors, New, Visits, One-page, Pages / visit, Avg visit, Leads, Sales, Revenue and Bought (the share of visitors who bought). The channels are Direct, Organic Search, Paid Search, AI Assistants, Organic Social, Paid Social, Email, Video, Affiliates, Referral and Display. The tabs above it switch the same table to Source / medium, Campaigns and Ad keywords. See Ad Keywords: Which Ad Keyword Brought Each Visitor. A hop between your own sites keeps the channel that brought the person in the first place.
🔎 What people searched on Google sits under it. Connect Google Search Console once and it lists the searches that brought people to the dates, site and page you picked. See Google Search Words: Connect Search Console Step by Step.
Where in the world:
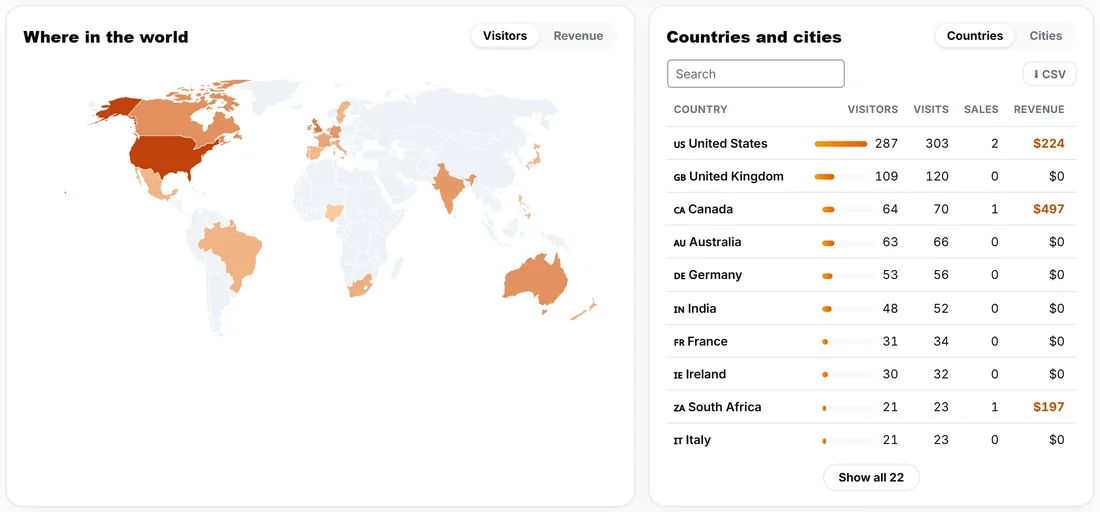
A map shaded by Visitors or Revenue, and a table by Countries or Cities with visitors, visits, sales and revenue. Search the table, download it with CSV, or press Show all.
Pages:
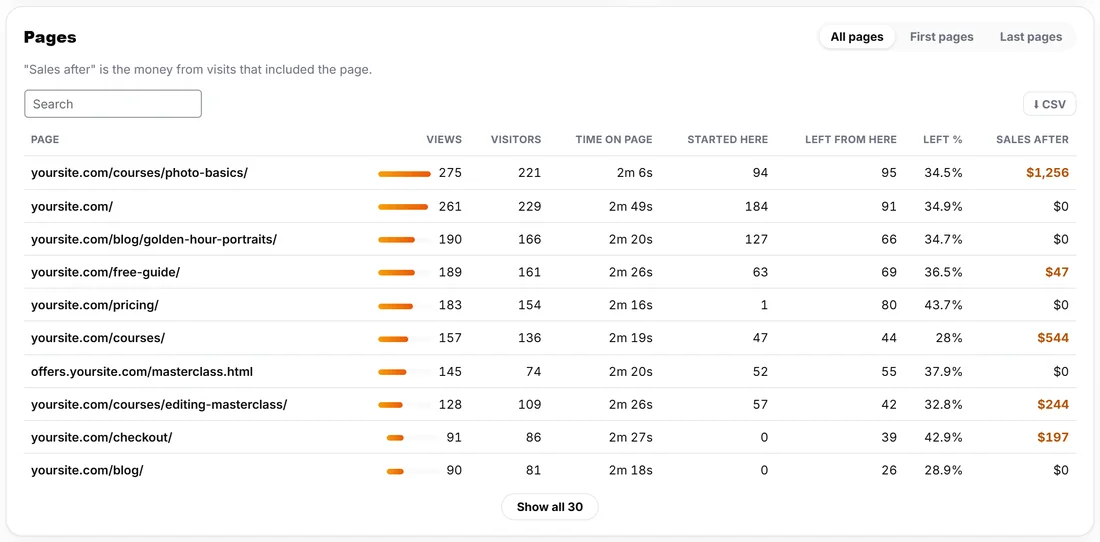
Every page with views, visitors, time on page, how many visits started and ended there, and the sales that followed. The tabs switch between All pages, First pages and Last pages.
The people who came:
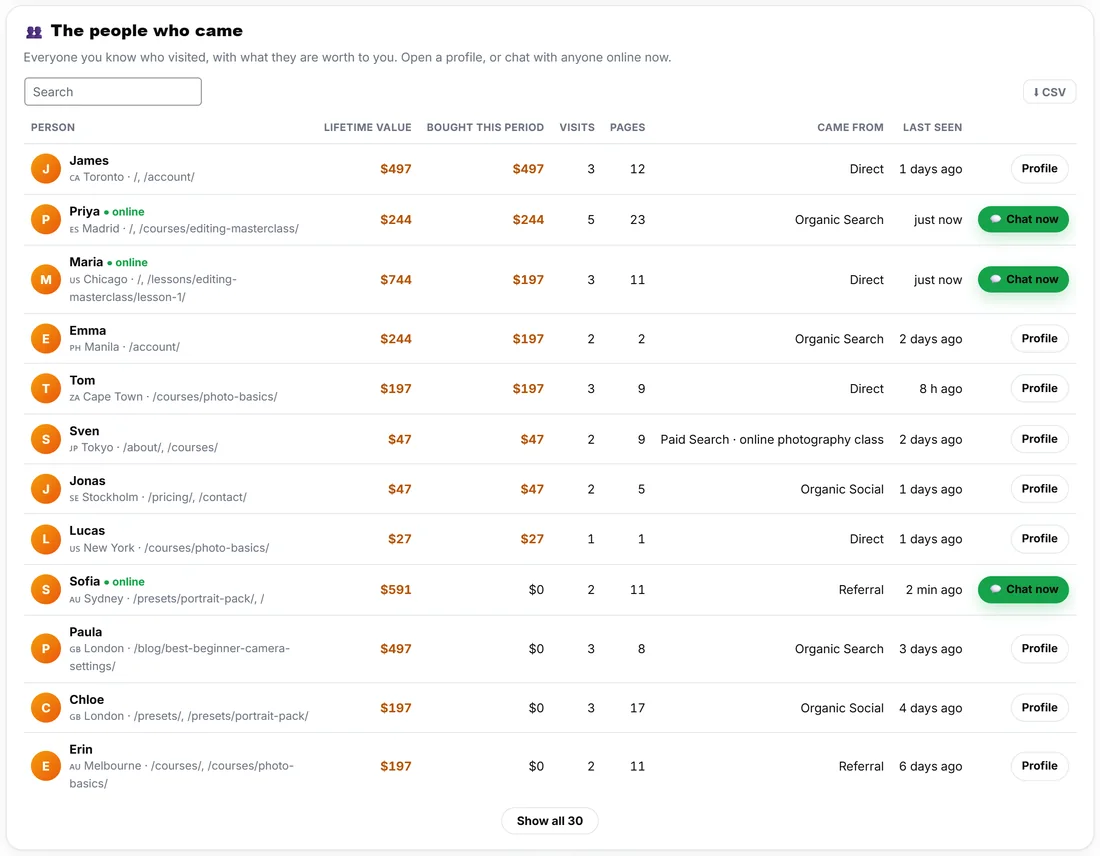
The most valuable visitors of the period, with lifetime value, what they bought in this period, visits, pages, leads, where they came from and when they were last seen. Somebody online right now has a Chat now button, and Profile opens their whole story.
From visitor to buyer:
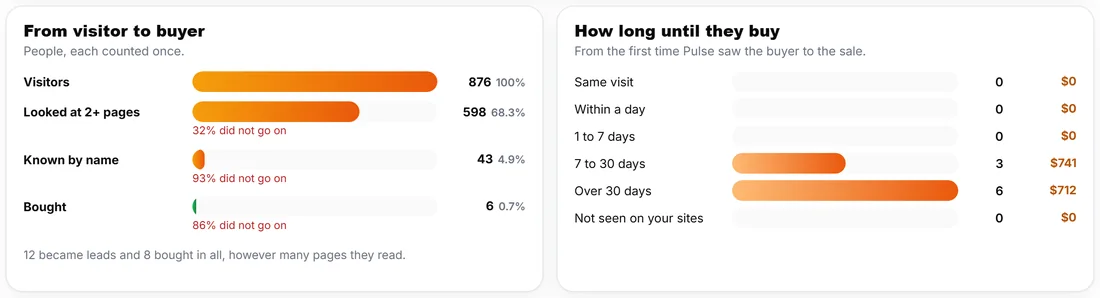
From visitor to buyer shows how many visitors read two or more pages, how many are known by name, and how many bought. How long until they buy groups the buyers by the time from their first visit: the same visit, within a day, 1 to 7 days, 7 to 30 days or over 30 days.
The visits that ended in a sale:
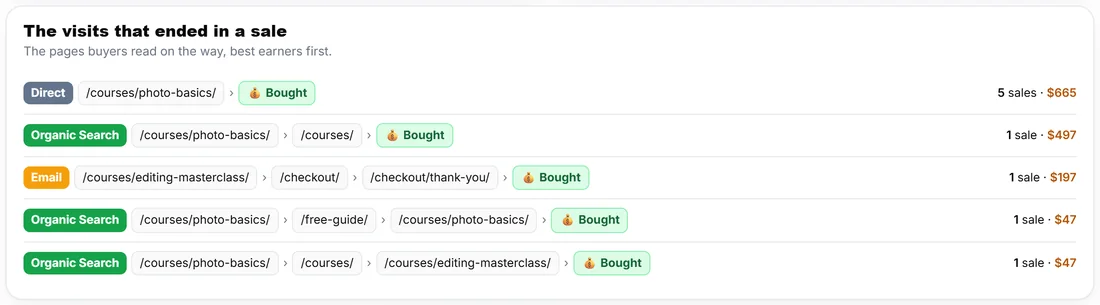
Each sale's path: the channel that brought them, the pages in order, and the product they bought.
Devices, technology and time:
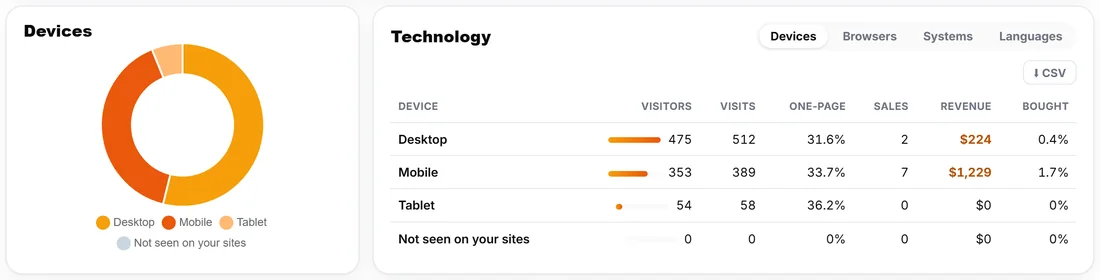
Devices splits visitors into desktop, mobile and tablet. Technology lists the same with visitors, visits, one-page visits, pages, revenue and bought, with tabs for Devices, Browsers, Systems and Languages.
When they visit, and whether they come back:
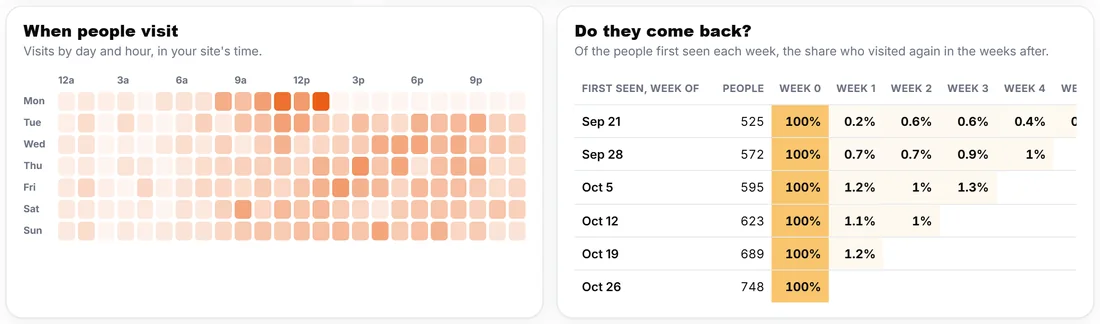
When people visit is a week by hour heat map in your timezone. Do they come back follows the people who first came in each week, and shows what share returned in each week after.
Sales:
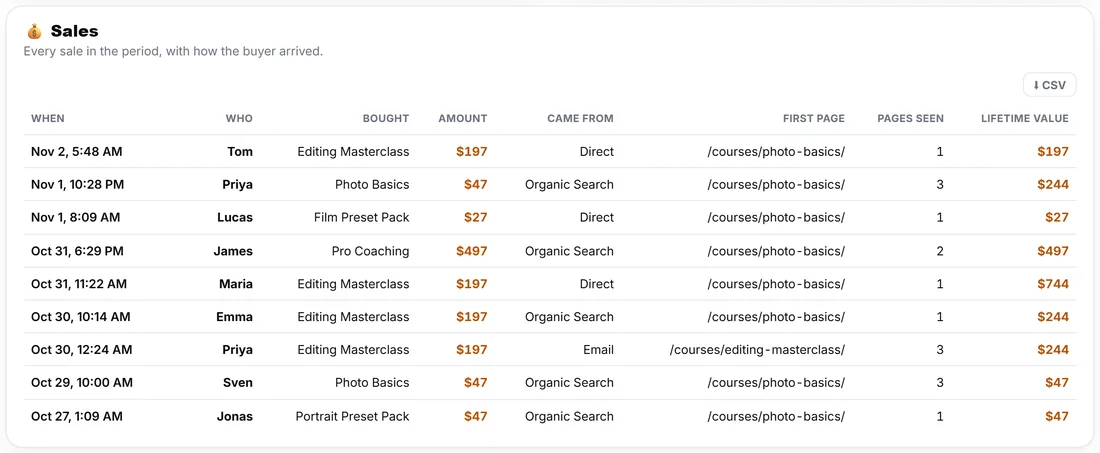
Every sale in the period: when, who, what they bought, the amount, where they came from, the first page and their lifetime value. At the bottom, Your sites side by side compares your sites.
Click to filter:
Click a channel, a keyword, a country (in the table or on the map), a page or a device, and the whole report narrows to it. Each filter shows as a chip at the top: click it to take it off, or Clear all.
A real example:
The owner of yoursite.com picks 30 days and clicks Revenue. The chart shows two big days, both the day after the newsletter. Under How people find you, Email has fewer visitors than Organic Search but more revenue per visitor. Clicking Email narrows the whole page: The visits that ended in a sale shows the newsletter link landing on the Editing Masterclass page, then checkout. Next month the newsletter links straight to that page.
Tips:
- Most tables have a CSV button for a spreadsheet.
- Keep visits long enough for the comparisons you want. Settings, Data & Access, Retention (days): 3650 keeps ten years.
- Each number's change only shows when Pulse holds the whole period before.