The Dashboard is the first screen Pulse opens on. It answers the questions an owner asks every morning: who came, who did I already know, who became a lead, who bought, who did I talk to, and what did the assistant cost. One date range drives the whole page, so nothing on it can disagree with anything else.
Where to find it:
WordPress menu, ResultsAiX Pulse, 📊 Dashboard. The buttons at the top right open the Live View, Stats, Chats and your Public Page.
At the top: This week at a glance:
Two cards sit above everything else and always cover the last 7 days.
- This week at a glance: plain sentences about the week. For example how many visitors you had against the week before, how much money came from how many sales and what each visitor was worth, which channel brought the most money, and what grew the most.
- The people behind your numbers: how many visitors you know by name, how many customers came back, and their lifetime value added up. See the full Stats opens the Stats tab.
Under the page title, the line Your own visits are not counted opens to explain how Pulse leaves you out.
The date range, chart style and site:
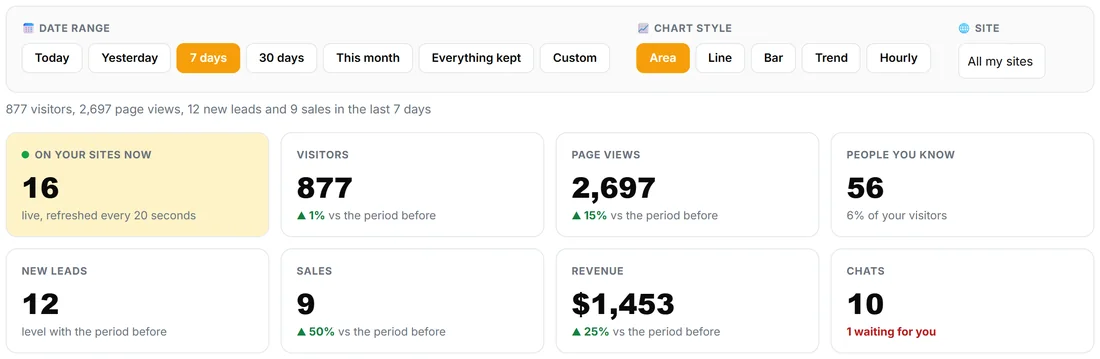
- Date range: Today, Yesterday, 7 days, 30 days, This month, Everything kept, or Custom with two dates and Apply. Today means today in your WordPress timezone.
- Chart style: Area, Line, Bar, Trend or Hourly. Hourly adds up the range by hour of the day, so it answers "what time of day are people here?"
- Site: All my sites, or one of your connected sites. The picker shows when more than one site is connected.
A line under the controls sums up the range, for example "877 visitors, 2,553 page views, 12 new leads and 9 sales in the last 7 days".
The headline numbers:
- On your sites now: people on any of your sites at this moment, refreshed every 20 seconds.
- Visitors: people, each counted once. One person reading six pages is 1 visitor and 6 page views.
- Page views: every page they opened.
- People you know: visitors your plugins know by name, and what share of all visitors that is.
- New leads, Sales and Revenue: from every ResultsAiX plugin that records them.
- Chats: chats in the range, and how many are waiting for you right now.
The small line under each number compares it with the same length of time just before, for example "▲ 9% vs the period before". Where Pulse does not hold the whole period before, it says so instead of comparing.
The two charts:
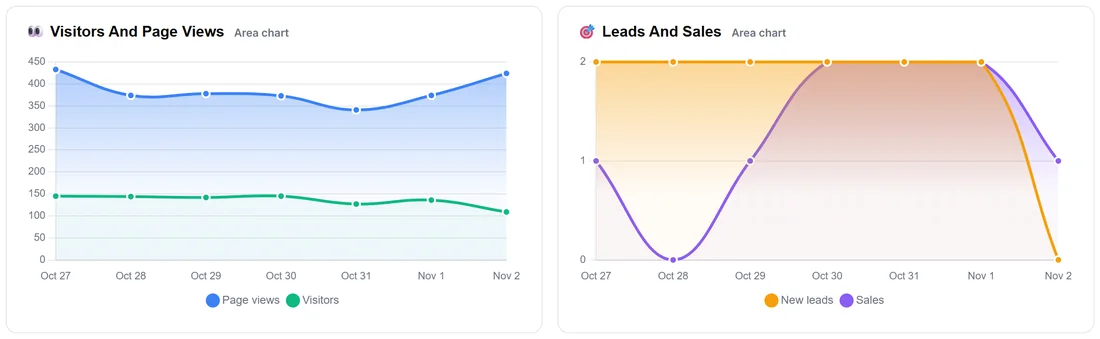
Visitors And Page Views shows both lines over the range. Leads And Sales shows new leads and sales on the same days. Hover any point for its exact figure.
Top pages, where they came from, top countries:
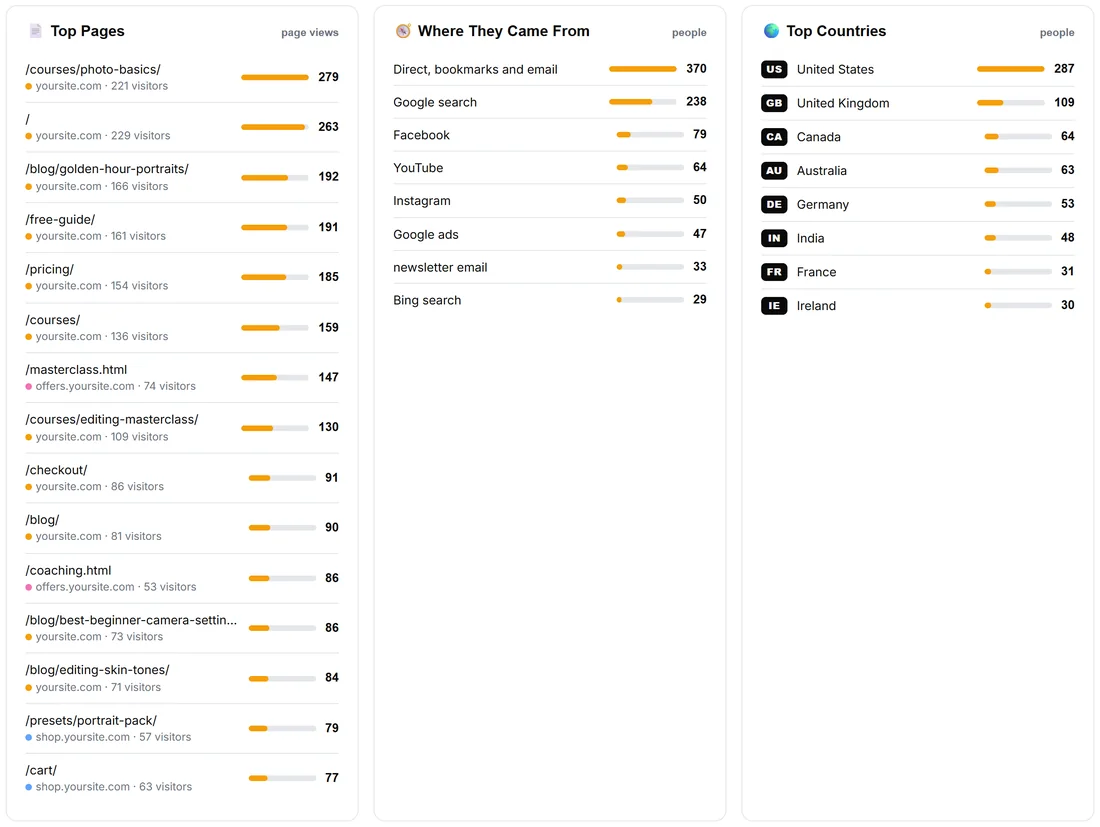
- Top Pages: page views per page, with the site it is on and how many visitors read it.
- Where They Came From: people per source in plain names, such as Google search, Facebook, YouTube, Google ads or newsletter email. A visit with no referrer shows as Direct, bookmarks and email. Your own addresses never count as a source.
- Top Countries: people per country.
People you know, and the latest sales and leads:
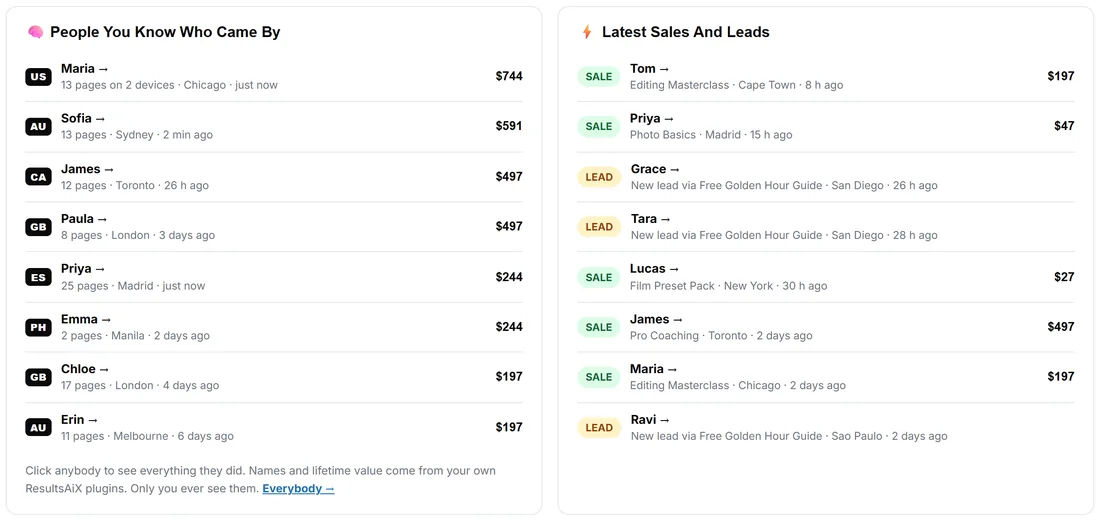
People You Know Who Came By lists the known visitors of the range, most valuable first, with their lifetime value, how many pages they looked at, on how many devices, the city and when they were last seen. Latest Sales And Leads lists each sale with the product and amount, and each new lead with the form it came through. Click any name to open that person's whole story on the People tab.
Your sites, side by side:
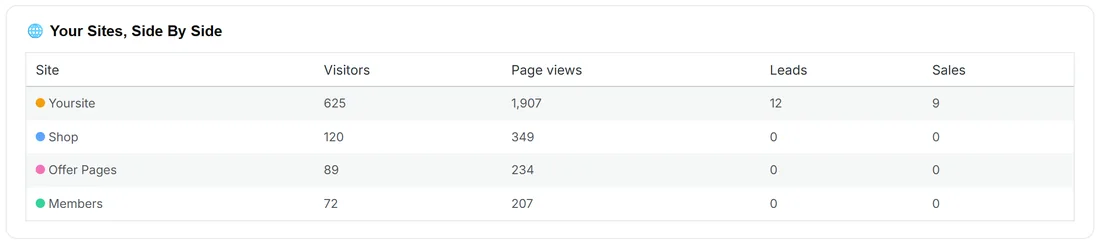
With more than one site connected, this table shows visitors, page views, leads and sales for each site, each in its own colour.
Conversations, and what the assistant cost:
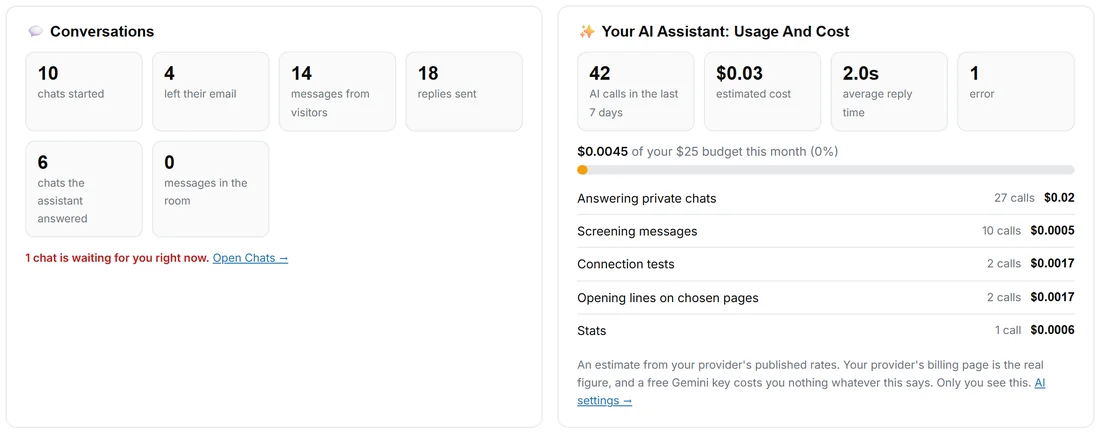
- Conversations: chats started, how many left their email, messages from visitors, replies sent and how many chats the assistant answered. A red line says how many chats are waiting for you, with Open Chats.
- Your AI Assistant: Usage And Cost: AI calls in the range, the estimated cost, the average reply time and errors, then this month's spend against your monthly budget and the split by job, such as Answering private chats, Screening messages and Opening lines on chosen pages. See AI Usage and Cost: What the Assistant Spent.
The Setup card:
At the bottom, Setup lists the steps that make Pulse complete, with a tick for each one done and a button for each one left. See Quick Start: Watching Your Visitors in Five Minutes.
A real example:
On Monday the owner of yoursite.com picks 7 days. The glance card says 876 visitors, up 1% on the week before, and $1,453 from 9 sales. Organic Search brought the most money. Under People You Know Who Came By, Maria from Chicago ($744) came back twice on two devices. The owner clicks her name, sees she bought the Editing Masterclass on Saturday, and opens her chat history from the timeline.
Tips:
- Press Everything kept to see the whole history Pulse holds. How far back that goes is set under Settings, Data & Access.
- For channels, ad keywords, devices, hours and the visits that led to a sale, open the 📈 Stats tab. See Stats: The Full Report, with the Money and the People Behind It.