Email is where most of your sales start, so when ResultsAiX Mailer is switched on, the Overview opens with a Mailer section right under the health row. You see how your list is growing and how your emails are doing before anything else, without opening the Mailer.
Where to find it:
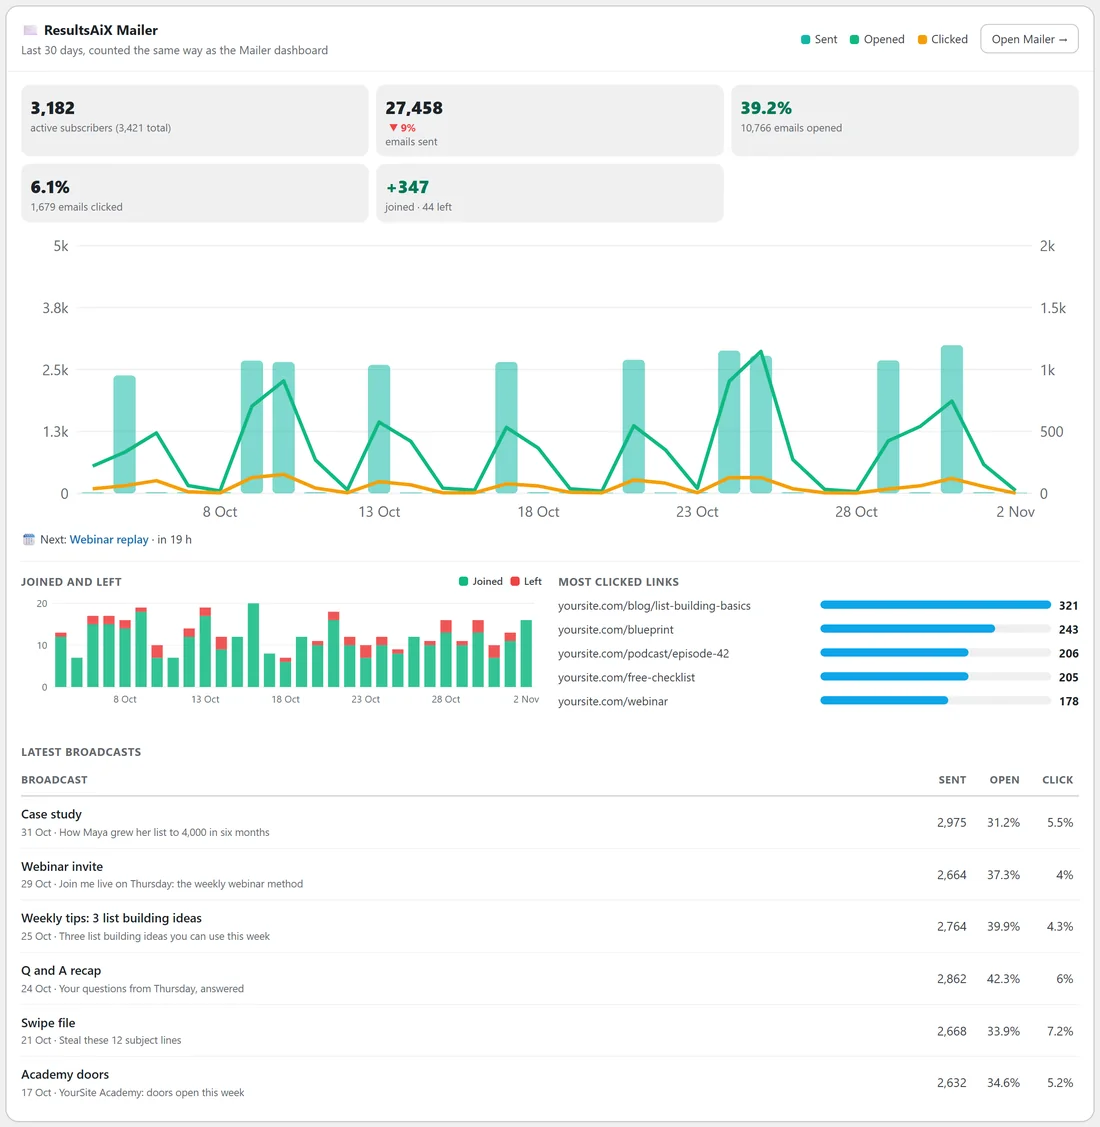
Open ResultsAiX Hub. The section called ResultsAiX Mailer is the first card under the health row. The Open Mailer button in its top right corner takes you to the Mailer's own dashboard. If the Mailer is switched off, the section does not appear at all.
The same numbers as the Mailer:
For every named range, the figures are counted the way the Mailer's own dashboard counts them, over the same window, so the two screens agree. The line under the title says so: Last 30 days, counted the same way as the Mailer dashboard.
For a Custom range the Hub asks for the Mailer's figures separately. For the moment that takes, the section is built from the day by day numbers and the line under the title says from the day by day numbers. It updates itself as soon as the Mailer's figures arrive.
The boxes:

- Active subscribers, with your total list size beside it in brackets
- Emails sent, with the change against the period before
- Opened: the share of sent emails that were opened, and how many emails that was. An email opened five times counts once
- Clicked: the share of sent emails that got a click, and how many. Unsubscribe, view in browser and confirm links are not counted as clicks
- Joined and left: new subscribers with a plus sign, and how many unsubscribed, bounced or complained. It shows green when more joined than left
- Email revenue: the Mailer's own Email Revenue figure, meaning sales after a click in one of your emails, with how many sales that was. It only appears when your Mailer reports email revenue
Why a rate sometimes shows as a number:
On a short range, opens and clicks can belong to emails sent before the range started. When there are more opens than emails sent in the range, a percentage would be meaningless, so the box shows how many emails were opened or clicked instead and adds that some were sent before this period. Pick a longer range and the percentage comes back.
The chart:
Bars are emails sent, measured on the left scale. The green line is emails opened for the first time that day and the amber line is emails clicked for the first time that day, both on their own scale on the right so they stay readable next to big send days. A legend in the top right names the three colours. Hover over a bar for that day's sent, opened and clicked numbers.
What is sending:
Under the chart one line tells you what is going out:
- Sending now, with the broadcast's name as a link and how many emails are queued
- Next, with the next scheduled broadcast and how long until it goes, for example in 19 h
- How many automation emails are queued, when no broadcast is sending or scheduled
- Nothing sending right now, when nothing is going out
Joined and left, and your most clicked links:

Below that line, a small chart shows who joined (green) against who left (red) each day. Beside it, Most clicked links lists your five most clicked links for the range, with the address shortened so it is easy to read and the number of emails that clicked it. For a Custom range the links appear once the Mailer's figures have arrived.
Latest broadcasts:
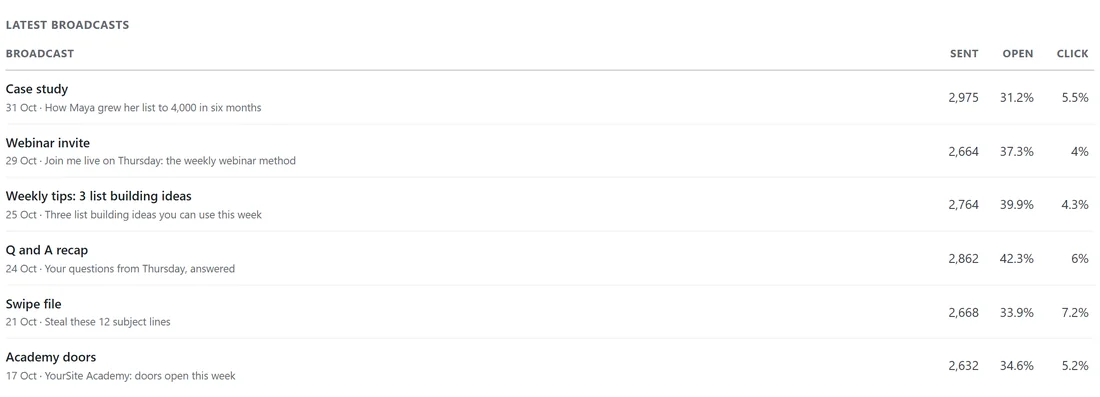
Your six most recent sent broadcasts, newest first. Each row shows the broadcast name, the date it went and its subject line, then how many were sent and its open and click rates. When the Mailer reports revenue for them, a Revenue column is added. Click a broadcast to open its report in the Mailer.
A real example:
On yoursite.com with 30 Days chosen, the section shows 3,182 active subscribers out of 3,421 in total, 27,458 emails sent, 39.2 percent opened and 6.1 percent clicked, and 347 people joined against 44 who left. The line under the chart says Next: Webinar replay, in 19 h, so Jamie knows the replay email goes out tomorrow morning. The most clicked link this month is the list building basics blog post, and the latest broadcast, Case study, reached 2,975 people with a 31.2 percent open rate.
How it follows the Range bar:
Every box, the chart, the joined and left chart and the most clicked links follow the Range bar at the top of the Overview. Latest broadcasts always shows your six most recent broadcasts, whatever the range.
Step by step: check how your last broadcast did:
- Open the Overview and look at Latest broadcasts in the Mailer section.
- Compare its open rate with the broadcasts below it. A rate well under your usual one points to the subject line or the send time.
- Click the broadcast name to open its full report in the Mailer.
- Switch the Range bar to 7 Days and read Most clicked links to see what people clicked this week.
Tips:
- Check the Next line before you log off for the day: it is a good last look at a scheduled broadcast.
- Compare the open rate on 7 Days with 30 Days. A drop in the short range points to the most recent send.
- If your numbers differ slightly from another plugin's dashboard, see How The Overview Counts: One Person, One Sale. The Mailer section itself always matches the Mailer.