Engage counts four things for every campaign, every day: views, clicks, conversions and closes. Everything on screen comes from those.
Where to find it:
- Dashboard tab: totals for the last 30 days across every campaign.
- Campaigns tab: each campaign's own numbers for the last 30 days.
What each number means:
- Views: the campaign actually appeared to a visitor.
- Clicks: a visitor clicked its button, revealed a coupon, said yes on a two step, or accepted a cookie notice.
- Conversions: a completed opt-in, saved on your Leads tab.
- Click rate: clicks divided by views.
- Conversion rate: conversions divided by views.
The Dashboard:

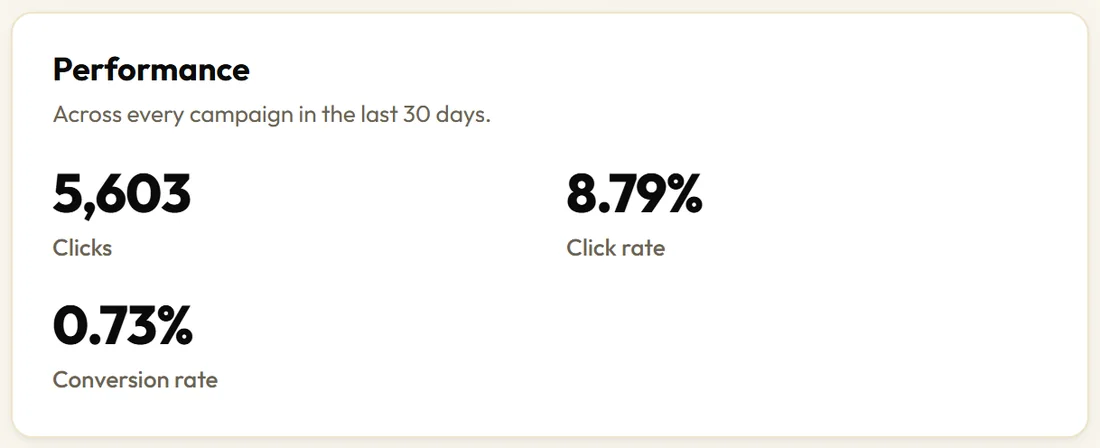
The four cards at the top show Live campaigns, Views, last 30 days, Conversions, last 30 days and Leads stored. The Performance card below adds Clicks, Click rate and Conversion rate across every campaign.
The Campaigns list:
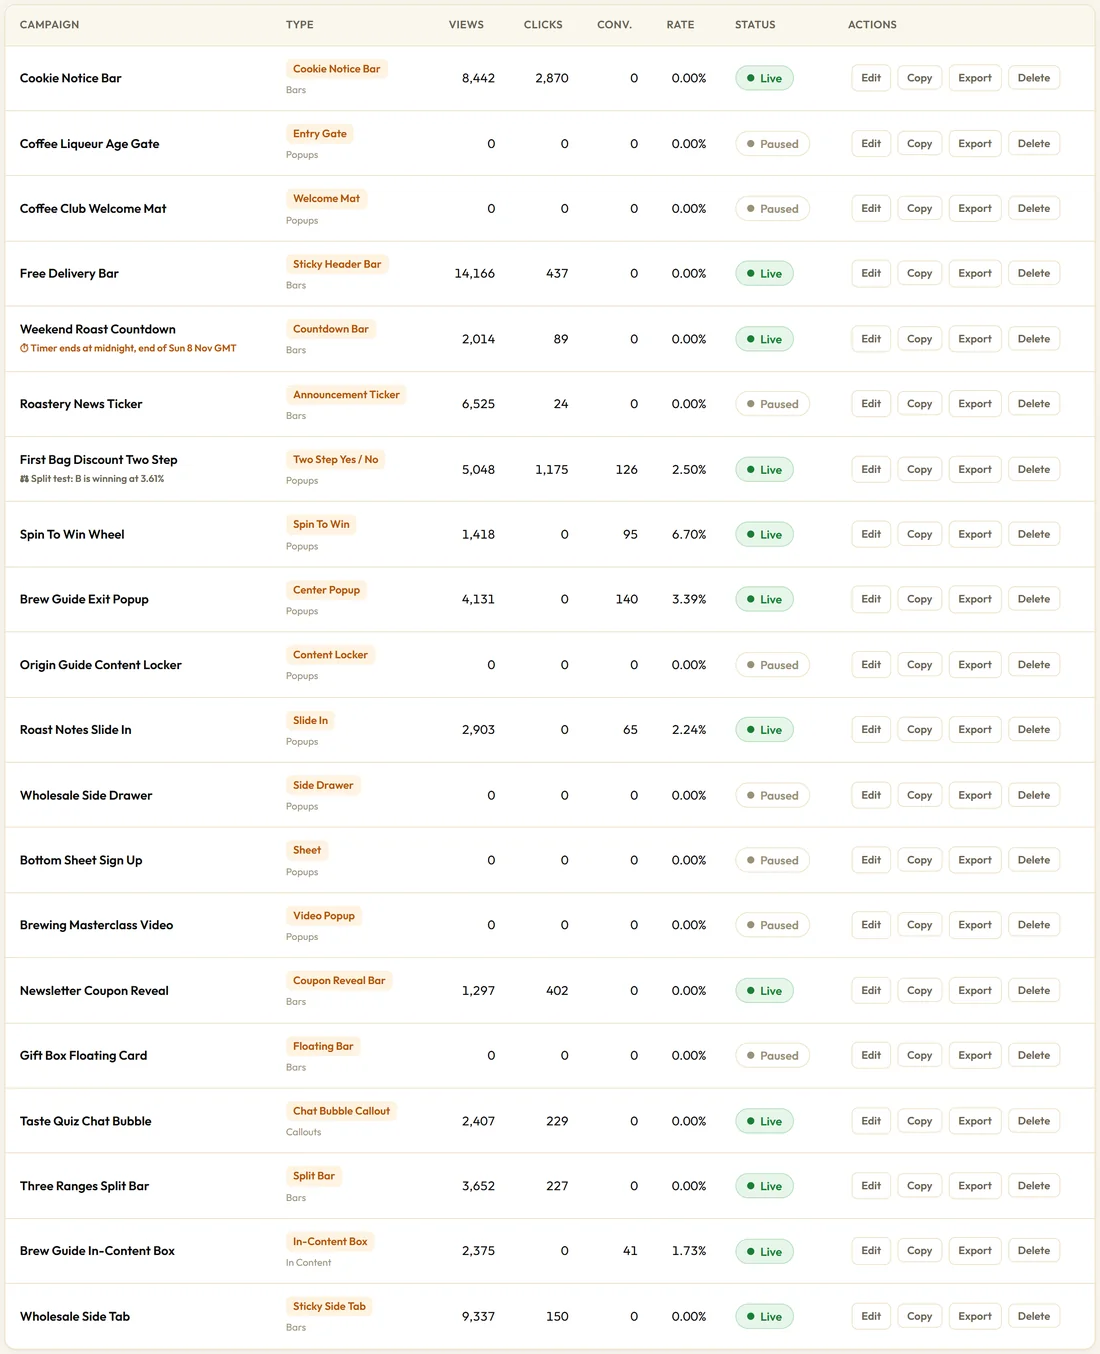
Each row shows Views, Clicks, Conv. and Rate, where Rate is the conversion rate. Read down the Rate column to see which opt-ins earn their place. A running split test shows its result under the campaign name.
Reading the numbers well:
- Plenty of views with a low click rate usually means the headline. Rewrite the offer before you change the colours.
- A good click rate with few conversions points at the step after the click: the form asks for too much, or the promise and the delivery do not match.
- Very few views is usually targeting or trigger. Check the Targeting tab first.
- Link campaigns, such as a delivery bar, have clicks and no conversions. Judge them on click rate.
Visitor consent:
When a consent banner on your site is asking visitors, Engage waits for each visitor's yes before counting their views and clicks. Campaigns still show to everyone. See Settings Explained.
Do Not Track:
Settings has Respect Do Not Track. When it is on, views and clicks are not counted for visitors whose browser sends that signal. Campaigns still show.
A real example:
Northside's list shows the Spin To Win Wheel at 6.70 percent and the Brew Guide Exit Popup at 3.39 percent. The Free Delivery Bar has no conversions, which is right for a link bar, and its click rate tells them how many people head to the shop.
A weekly review in five minutes:
- Open the Campaigns list.
- Look at Views first: a campaign with very few views needs its targeting or trigger checked.
- Read Rate for opt-in campaigns, and click rate for link campaigns.
- Read any split test notes under the campaign names.
- Pick one campaign to improve this week, change one thing, and note the date.
What counts as a view:
A view is counted when the campaign actually appears on screen, not when the page loads. A popup that waits for exit intent only counts a view when it opens, so its rate is a fair measure of the people who saw it.
Comparing two campaigns fairly:
Compare campaigns with the same goal: opt-in against opt-in on Rate, link against link on click rate. A popup that opens on exit intent and a bar shown on every page reach very different numbers of people, so compare their rates, not their totals.
Tips:
- Compare campaigns on Rate, not on raw conversions.
- Change one thing at a time and wait for a few hundred views before judging.
- The Leads tab ties every subscriber back to the campaign that earned them.