AI Insights is the full report for one survey. It shows how many people saw, started and finished it, charts over any date range, the answers given most, a plain English reading of the results and a breakdown of every question. Everything except the written reading works with no AI key.
Where to find it:
Click the AI Insights tab, or Report on any survey row or on the Dashboard. When you have more than one survey, pick one in Showing. The buttons at the top are Every response, Print or save as PDF, Export CSV and Edit. The survey's goal shows under its title.
The numbers along the top:
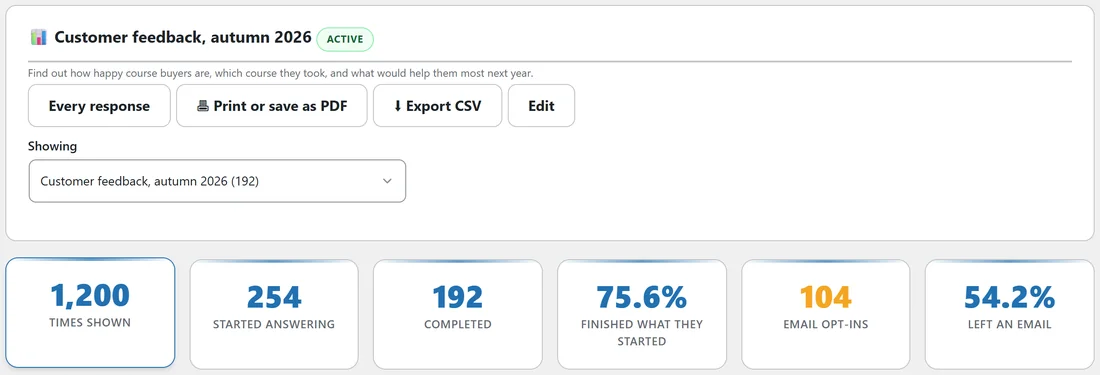
- Times shown: how often the survey appeared on a screen. A popup counts when it opens. Previews never count.
- Started answering: how many people answered the first question they were shown.
- Completed: finished responses.
- Finished what they started: completed as a share of started. The gap is people who began and stopped, a sign the survey is too long or a question is too personal.
- Email opt-ins and Left an email: how many finished responses came with an email, as a number and a share.
The gap between shown and started is people who saw the survey and walked past it, which points at your heading or first question.
Counting views and starts began in version 1.0.18. A survey that collected answers before then has responses without views, so the shown and started cards stay hidden until they can say something true, and a note explains it.
The charts:
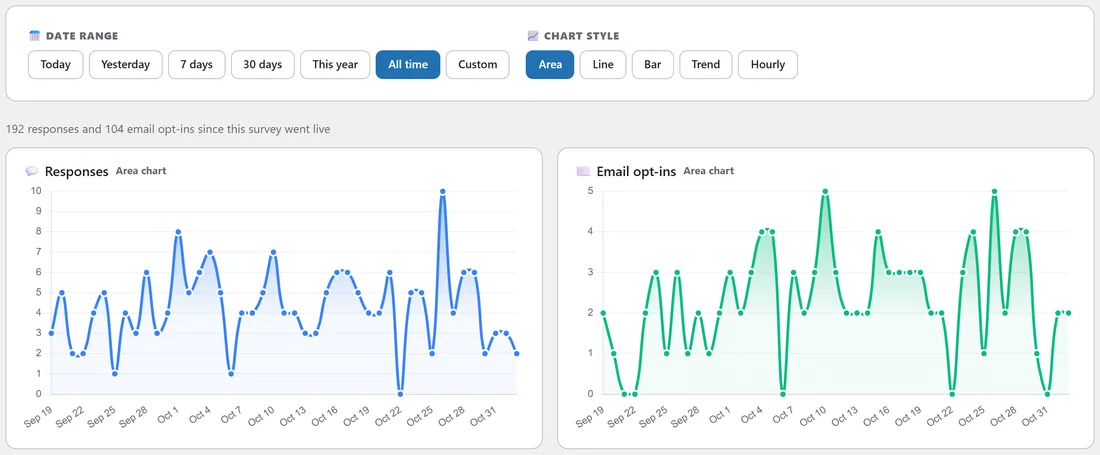
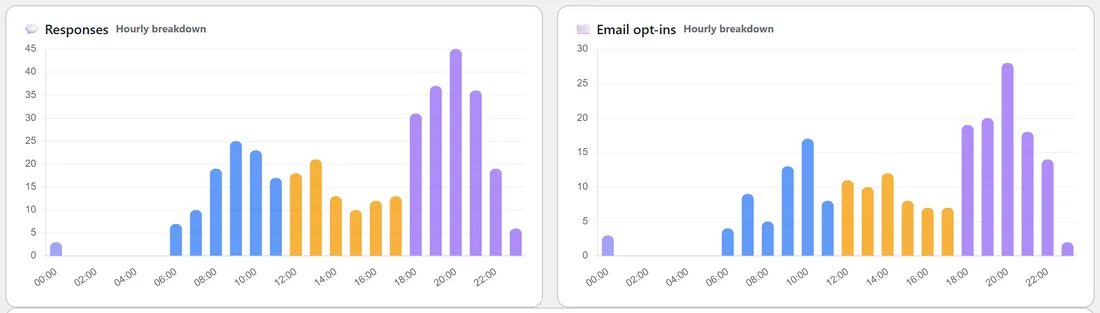
- Pick a Date range: Today, Yesterday, 7 days, 30 days, This year, All time or Custom. For Custom, choose two dates and click Apply. A single survey opens on All time.
- Pick a Chart style: Area, Line, Bar, Trend or Hourly.
Responses and Email opt-ins share one timeline, and quiet days are drawn as zero rather than skipped. Short ranges are drawn by hour, longer ones by day, and very long ones by week or month, so the chart stays readable. Hourly stacks the responses in your chosen range by the hour of day they arrived, which tells you when your audience actually answers. A line under the buttons sums up the range.
Most given answers:
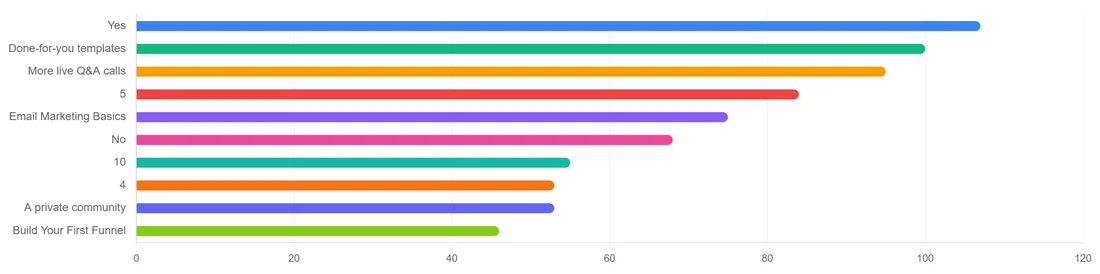
A ranked bar chart of the ten answers given most in the range you picked, across your multiple choice, checkbox, yes or no, star and score questions. Hover a bar to see which question it belongs to, since two questions can share an answer like Yes. Written answers are not ranked here; they are on the Responses tab, in the printable report and in the AI reading.
What the answers say:
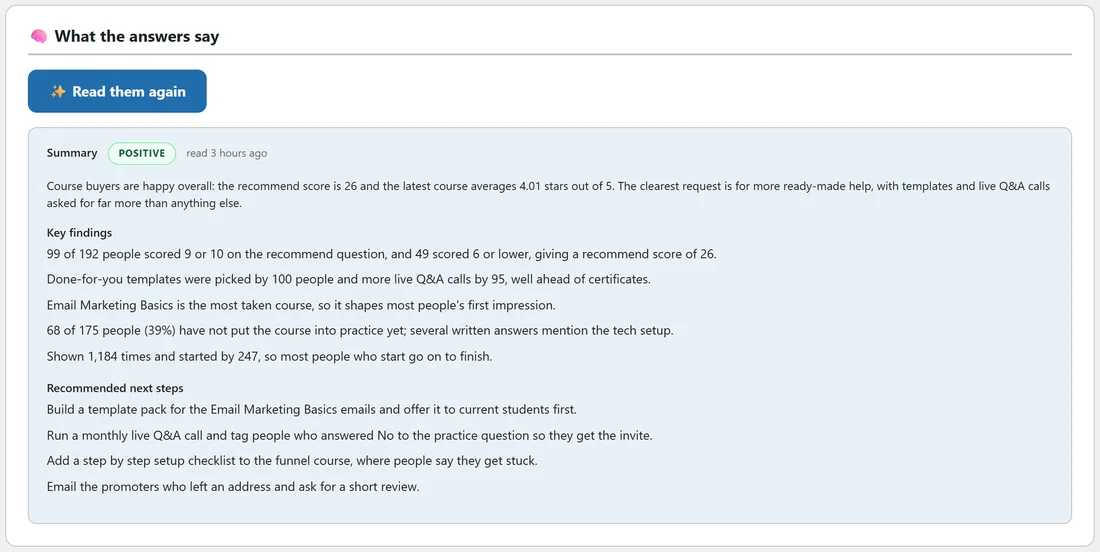
With an AI key connected, click Read my results. A window shows the progress, which usually takes 15 to 45 seconds. When it is done you get:
- Summary: two or three plain sentences, with a sentiment badge: positive, mixed, negative or n/a.
- Key findings: three to six observations grounded only in your data, with numbers.
- Recommended next steps: two to five concrete actions.
The reading is saved on the survey, with "read 3 hours ago" beside it, so it is there when you come back, and it appears in the printable report. Click Read them again whenever new answers arrive. The survey needs at least one finished response first. With no key, a single line links to the AI setup instead.
What is sent to your AI provider:
Only the survey title and goal, the number of responses, each question with its answer counts and averages, up to 60 written answers per question, and the shown, started and finished numbers. Names and email addresses are never part of it.
Question by question:
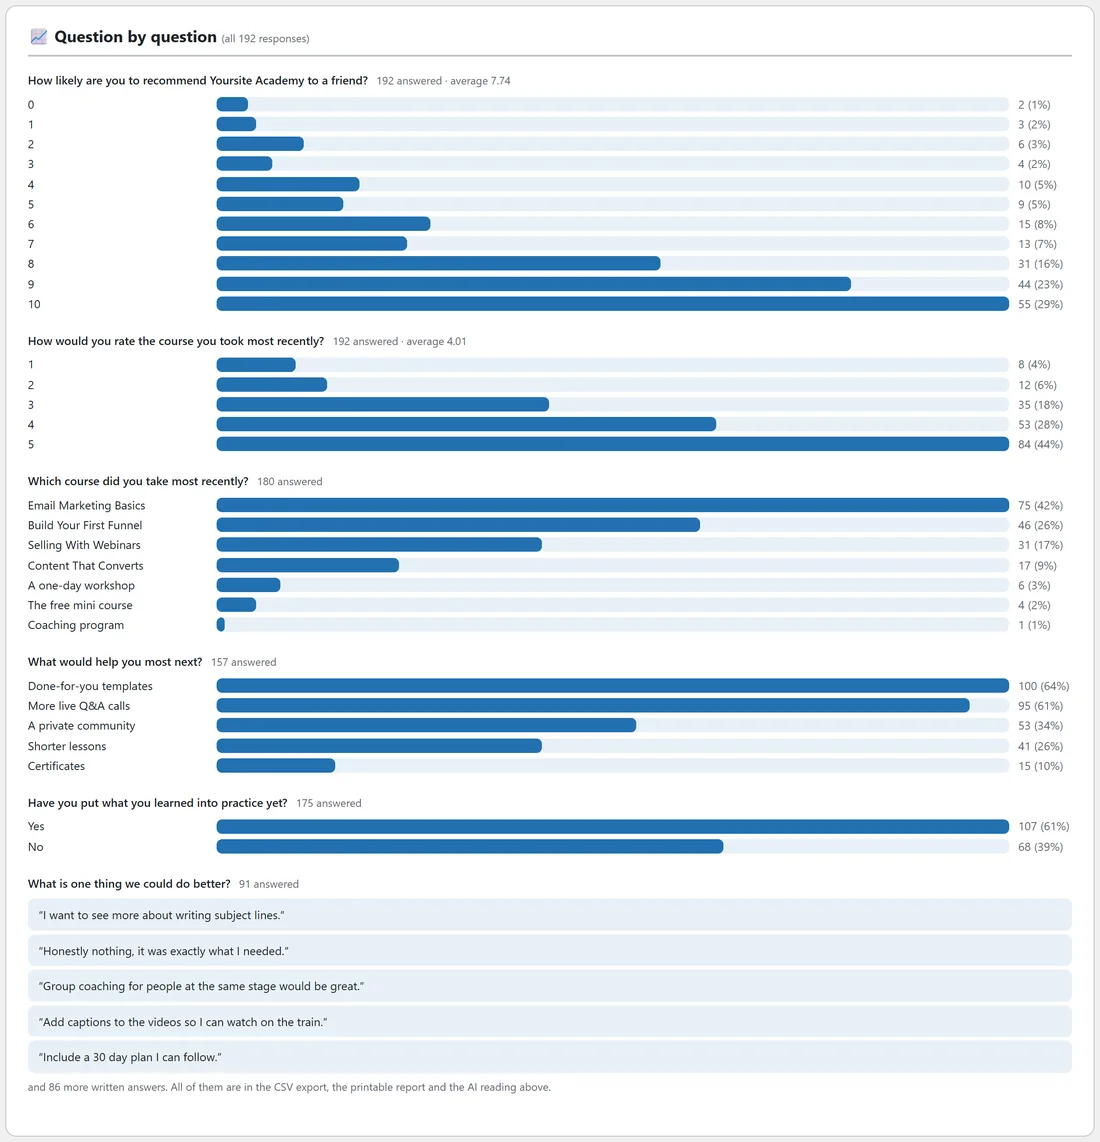
Below the reading, every question is broken down across all its responses: a bar for each answer with the count and percentage, the average for ratings and scores, five of the written answers with a count of the rest, and how many people answered that question. That last number is how you spot the question everybody skips.
A real example:
The Yoursite Academy feedback survey was shown 1,200 times, started by 254 and completed by 192, so 75.6% finished what they started and 54.2% left an email. The owner clicks Read my results. The summary says buyers are happy overall with a recommend score of 26, and the findings point to templates and live Q&A calls as the most wanted extras. The first next step, a template pack for the email course, becomes her December project.
Read one survey's results, step by step:
- Open AI Insights and pick the survey in Showing.
- Read the six cards from left to right: shown, started, completed, finished what they started, opt-ins and left an email. Note the biggest drop.
- Click 30 days to see the recent trend, then All time for the whole story.
- Look at Most given answers for the strongest signals.
- Click Read my results, or Read them again when new answers have arrived.
- Scroll to Question by question and look for the question with the lowest answered number.
- Click Every response to read individual answers behind anything that surprises you.
Comparing two periods:
Pick Custom, choose the first period's dates and click Apply, and note the summary line under the buttons. Then choose the second period and compare. It is a quick way to see whether a change to your heading or your first question made a difference.
Tips:
- Run the reading again after each big batch of answers and compare.
- Use the Hourly style to choose when to send survey emails.
- Share the printable report rather than screenshots. See Preview, Its Own Page, Embed Anywhere And PDF Reports.