Some reports will bring in far more subscribers than others. Tracking shows you which ones, so you spend your time promoting the winners. The plugin counts visits and opt-ins on its own, and lets you add Google Analytics and any tracking pixel to every funnel page.
What the plugin counts:
- Page Views: each time a report's squeeze page loads.
- Opt-ins: each time a report's download page loads, which happens right after the opt-in.
- Conversion Rate: opt-ins divided by page views.
The counts are kept for all time. Your own test visits count too, which only matters in the first days.
The Dashboard:

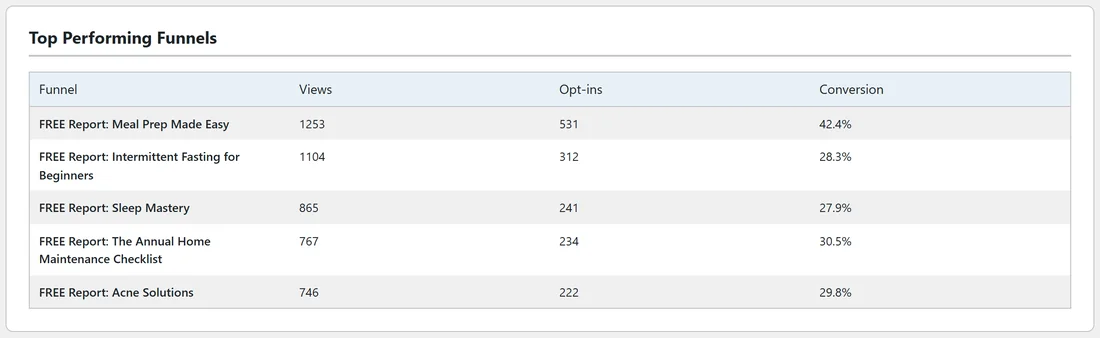
The four cards show Page Views, Opt-ins, Conversion Rate and Funnels Installed for the whole site. Top Performing Funnels lists the five reports with the most opt-ins, with their Views, Opt-ins and Conversion.
One report's stats:
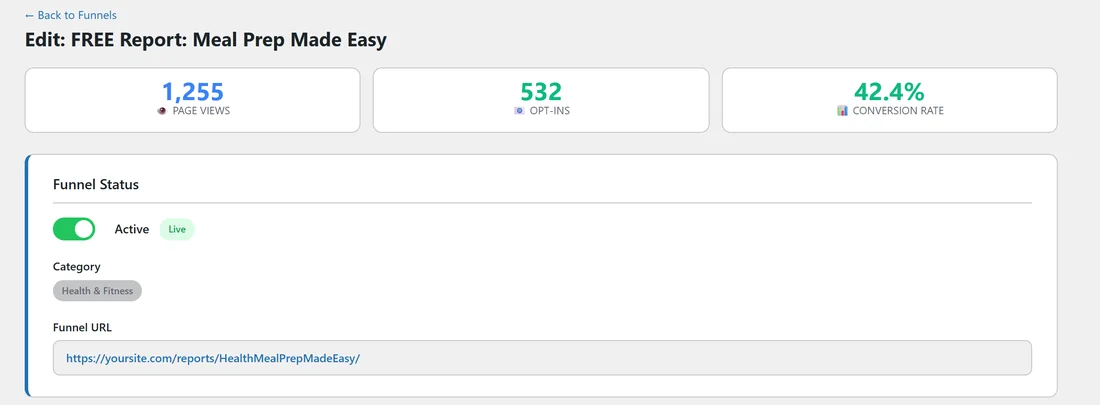
Open a report's Edit page. The three boxes at the top show its Page Views, Opt-ins and Conversion Rate. The rate is green at 20% and above, amber from 10%, and red below 10%.
Splash Page clicks:
Each Splash Page counts its views and the clicks on each cover. See Splash Pages.
The Lists tab:
The Optins column shows the total per report, and Collected Emails lists every lead with its date. See The Lists Tab And Exporting Opt-Ins.
Google Analytics:
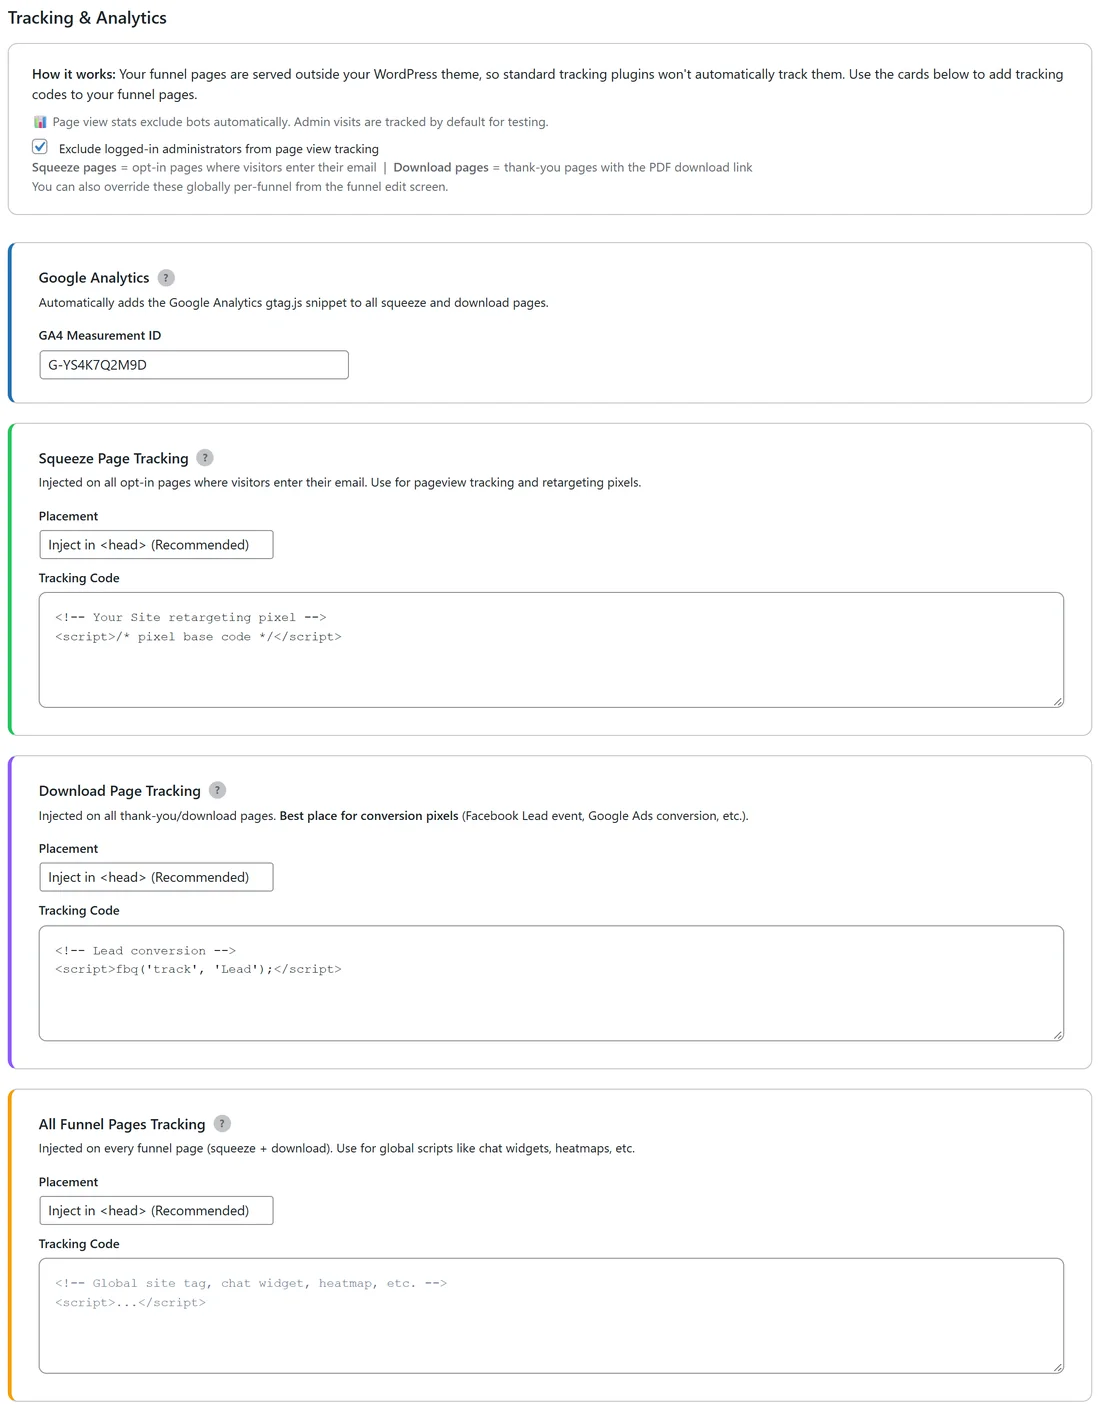
- Go to Settings and scroll to Tracking & Analytics.
- In the Google Analytics card, type your GA4 Measurement ID, which starts with G-.
- Click Save Settings.
The plugin adds the Google Analytics tag to every squeeze page and download page. Funnel pages are served outside your theme, so tracking plugins that work through your theme do not reach them. This card is the way to add it.
Tracking codes for every report:
Three cards hold your own code, such as a Facebook pixel:
- Squeeze Page Tracking: runs on every opt-in page. Use it for page view and retargeting pixels.
- Download Page Tracking: runs on every download page. This is the best place for conversion pixels, such as a Facebook Lead event or a Google Ads conversion, because the page only loads after an opt-in.
- All Funnel Pages Tracking: runs on both. Use it for chat widgets, heatmaps and site wide tags.
Each card has a Placement menu: Inject in <head> (Recommended) or Inject before </body>. Paste the full code your ad platform gives you, including the script tags, then click Save Settings.
Tracking codes for one report:
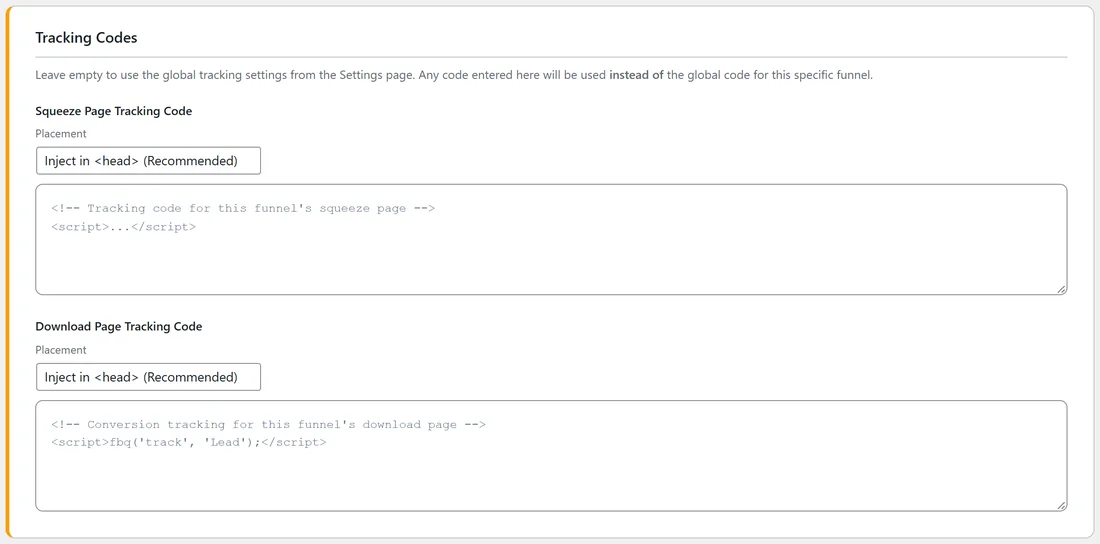
On a report's Edit page, the Tracking Codes section has Squeeze Page Tracking Code and Download Page Tracking Code, each with its own Placement. Code here is used instead of the matching code in Settings, for this report only. The Google Analytics tag and All Funnel Pages Tracking still run on it. The tag Override active shows when a report has its own code.
The admin visits option:
The Tracking & Analytics box has a tick box: Exclude logged-in administrators from page view tracking. It keeps your own visits out of the plugin's detailed page view log, the Page Views (detailed) table you see on the Diagnostics tab.
A real example:
After a month, the yoursite.com Dashboard shows 13,740 page views, 4,159 opt-ins and 30.3%. Meal Prep Made Easy leads with 1,253 views, 531 opt-ins and 42.4%. Intermittent Fasting for Beginners has nearly as many views but converts at 28.3%.
So the owner tested a custom headline on Intermittent Fasting for Beginners, and kept promoting Meal Prep Made Easy with the Traffic Toolkit. In Settings they added their GA4 ID G-YS4K7Q2M9D, a retargeting pixel in Squeeze Page Tracking, and fbq('track', 'Lead') in Download Page Tracking, so their ads platform learns who opts in.
Tips:
- Judge a report after at least 100 page views. Small numbers swing a lot.
- Compare reports in the same niche. A gaming report and a beauty report attract different visitors.
- Change one thing at a time, then watch the Conversion Rate for a week.