Two screens show how your funnels are doing. The Dashboard gives you the last 30 days at a glance. The Stats tab lets you pick any date range, any funnel, and see it page by page.
Where to find it:
- Dashboard: open AiX Funnels. The Last 30 Days sits under the six ready made funnels.
- Stats: the Stats tab, the Open Full Stats button on the Dashboard, or Stats on any funnel's row.
The Dashboard:
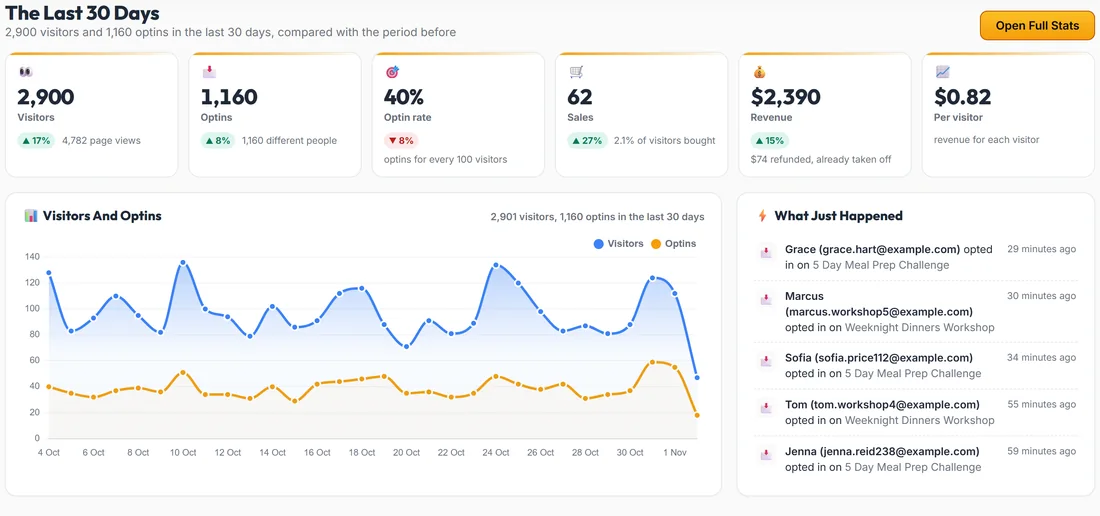
The Last 30 Days shows six cards: Visitors, Optins, Optin rate, Sales, Revenue and Per visitor. Each one compares with the 30 days before, with a green or red change badge. A chart shows visitors and optins day by day, and What Just Happened lists the newest optins and sales as they arrive.
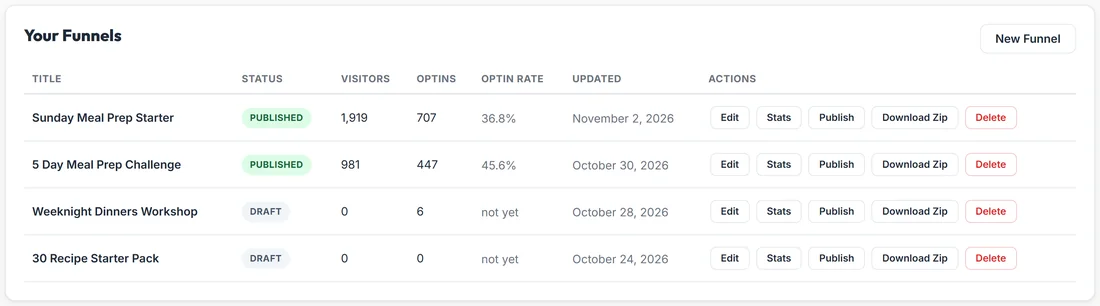
Below that, Your Funnels lists every funnel with its Status (Draft or Published), Visitors, Optins and Optin Rate for the last 30 days, and when it was updated. Each row has Edit, Stats, Publish, Download Zip and Delete.
The Stats screen, step by step:
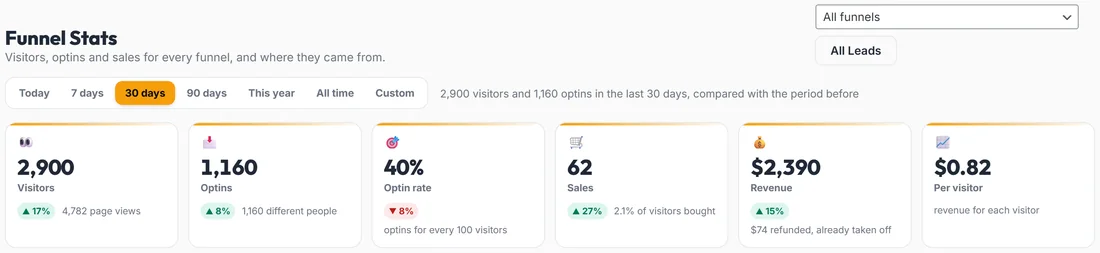
- Open Stats.
- Pick a date range: Today, 7 days, 30 days, 90 days, This year, All time, or Custom with your own dates and Show.
- Pick a funnel in the list at the top right, or leave All funnels.
- Read the cards, then the charts below them.
What is on the Stats screen:
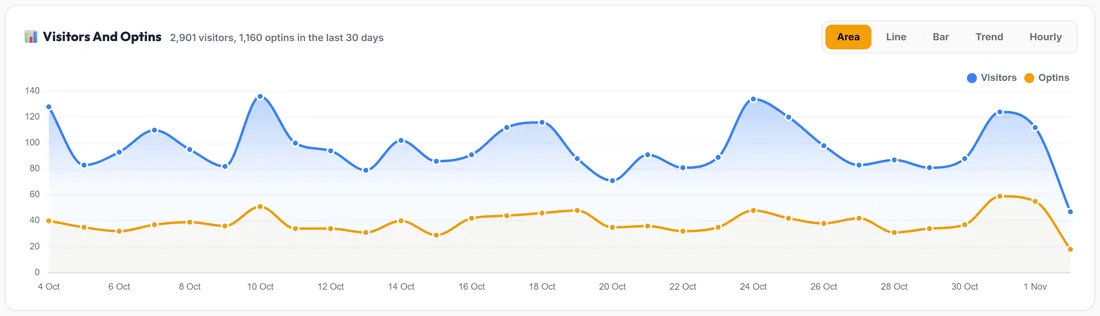
- The cards: Visitors, Optins, Optin rate, Sales, Revenue and Per visitor, each with the change against the period before
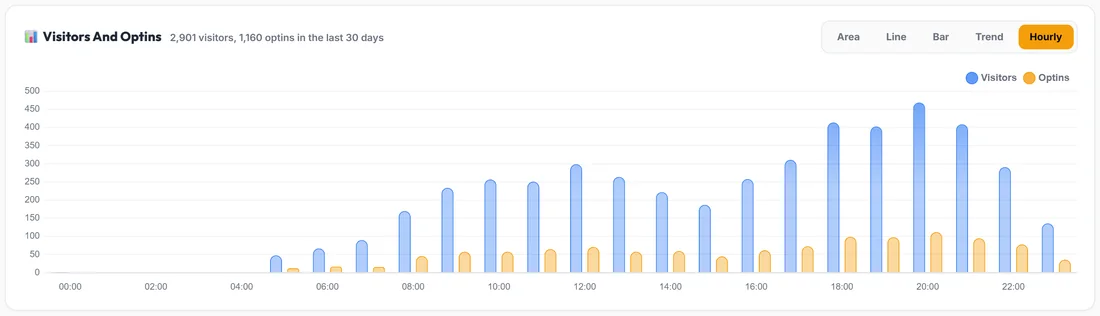
- Visitors And Optins: a chart with five styles: Area, Line, Bar, Trend (a running total) and Hourly (the time of day people arrive)
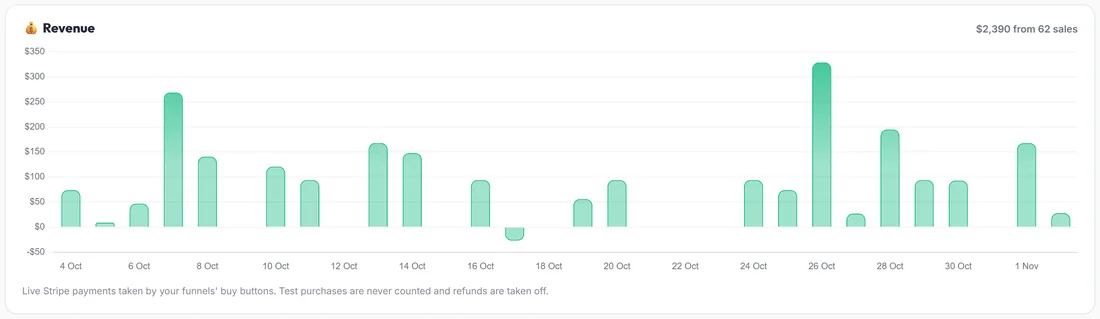
- Revenue: a chart that appears once a buy button has taken a live payment. Refunds show below the line
- From Visitor To Buyer: how many people visited, opted in and bought. With one funnel picked, it becomes Page By Page
- Where They Came From: the top sources, with Visitors and Optins buttons to switch between them
- Every Funnel: all your funnels side by side, busiest first, with Stats and Edit buttons
- What Just Happened: the latest optins and sales
One funnel, page by page:
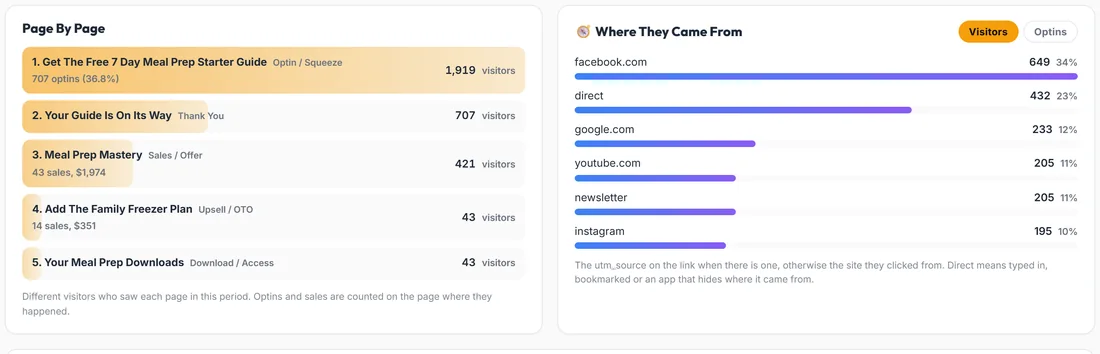
Pick a funnel at the top, or press Stats on its row. Page By Page shows how many people reached each page, with optins and sales counted on the page where they happened. This is where you find the page that loses people.
What each figure counts:
- Visitors: different people who viewed a published or exported funnel page. A reload within half an hour is not counted twice
- Optins: every lead your funnels saved, the same rows as the Leads screen
- Optin rate: optins for every 100 visitors. It says not yet until there are visitors to divide by
- Sales and Revenue: live Stripe payments from your buy buttons. Test purchases never count, and refunds are taken off
- Per visitor: revenue divided by visitors
- Where They Came From: the utm_source on the link when there is one, otherwise the site they clicked from. Direct means typed in, bookmarked, or an app that hides where it came from
What is never counted:
Your own visits while logged in to WordPress, the builder preview, search engine crawlers and link previews. The visitor count uses a random id kept in the visitor's browser, never their name, email or IP address.
When counting starts:
Visitors are counted from version 1.3.7 on. Pages already published to WordPress count straight away, with nothing to do. A funnel hosted elsewhere from a downloaded zip counts visitors once you download the zip again and upload it. Optins and sales were always recorded, so those go back to the start.
A real example:
In the last 30 days Calm Kitchen had 2,900 visitors, 1,160 optins, a 40% optin rate and 62 sales. Picking Sunday Meal Prep Starter shows Page By Page: 1,919 people saw the free guide page and 707 opted in. 421 reached Meal Prep Mastery, where 43 bought, and 14 of those buyers added the Family Freezer Plan. Where They Came From shows facebook.com bringing a third of the visitors, so Sarah knows where to spend her time.
Tips:
- Add utm_source to the links you share, for example ?utm_source=newsletter. Your sources become much clearer.
- Look at Page By Page before rewriting anything. Fix the page where most people stop.
- Use Hourly to choose when to send emails and run ads.