The Analytics tab shows what one webinar did: who signed up, who came, how long they watched, who saw and clicked the offer, and, with ResultsAiX Mailer recording your sales, what it earned.
Where to find it:
Open the webinar, then the Analytics tab. The Dashboard's Analytics buttons open it too.
Who Signed Up:
How many people signed up, how many before the show, for the replay after the show, and real people. Suspect sign-ups, ten or more from one source in one hour with none watching, stay in the People list but are kept out of the rates.
Live:
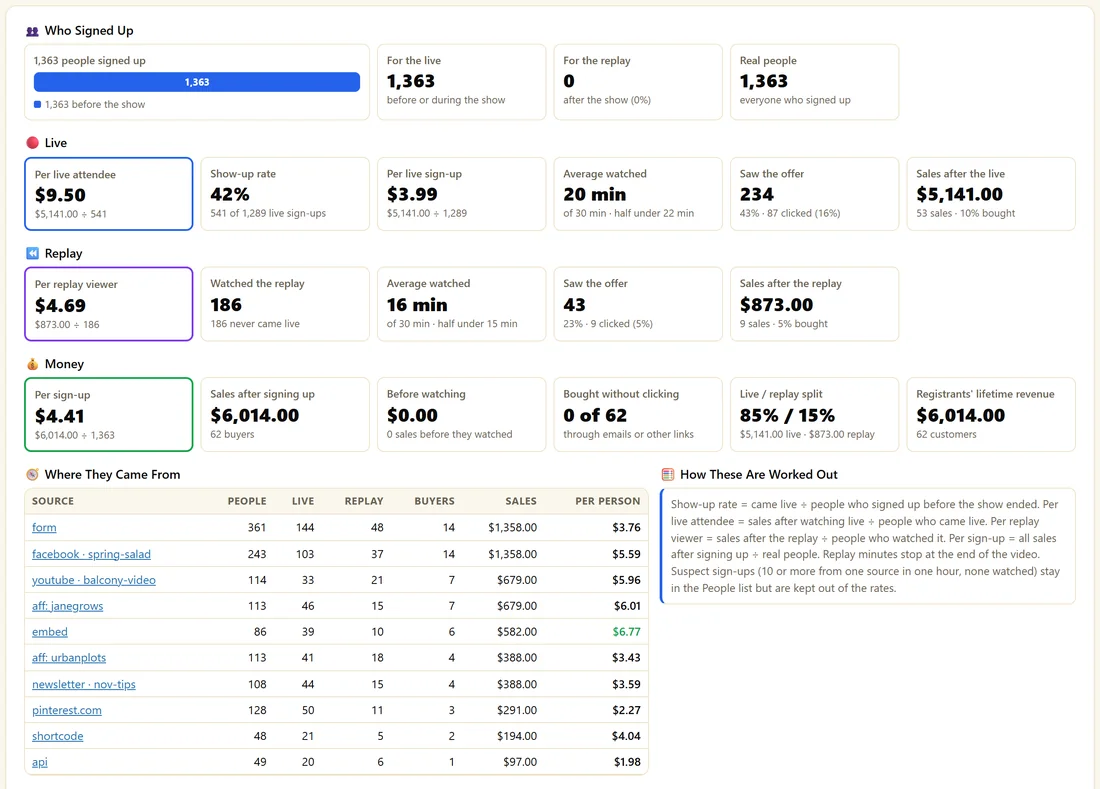
- Per live attendee. Sales after watching live divided by people who came live.
- Show-up rate. People who came live divided by people who signed up before the show ended.
- Per live sign-up. Live sales divided by live sign-ups.
- Average watched, with the length of the webinar and the middle value.
- Saw the offer, with how many clicked.
- Sales after the live, and the share who bought.
Replay:
- Per replay viewer. Sales after the replay divided by people who watched it.
- Watched the replay, and how many never came live.
- Average watched. Replay minutes are the furthest point reached in the video, so they stop at the end.
- Saw the offer and Sales after the replay.
Money:
Per sign-up, Sales after signing up, Before watching, Bought without clicking, Live / replay split and Registrants' lifetime revenue. The money figures appear when ResultsAiX Mailer is active on the same site and records your sales. A purchase under a different email is matched by name and marked, so you can undo the match.
Where They Came From:
Each source and campaign with People, Live, Replay, Buyers, Sales and Per person. How These Are Worked Out, beside it, explains every number in plain words.
At a Glance:
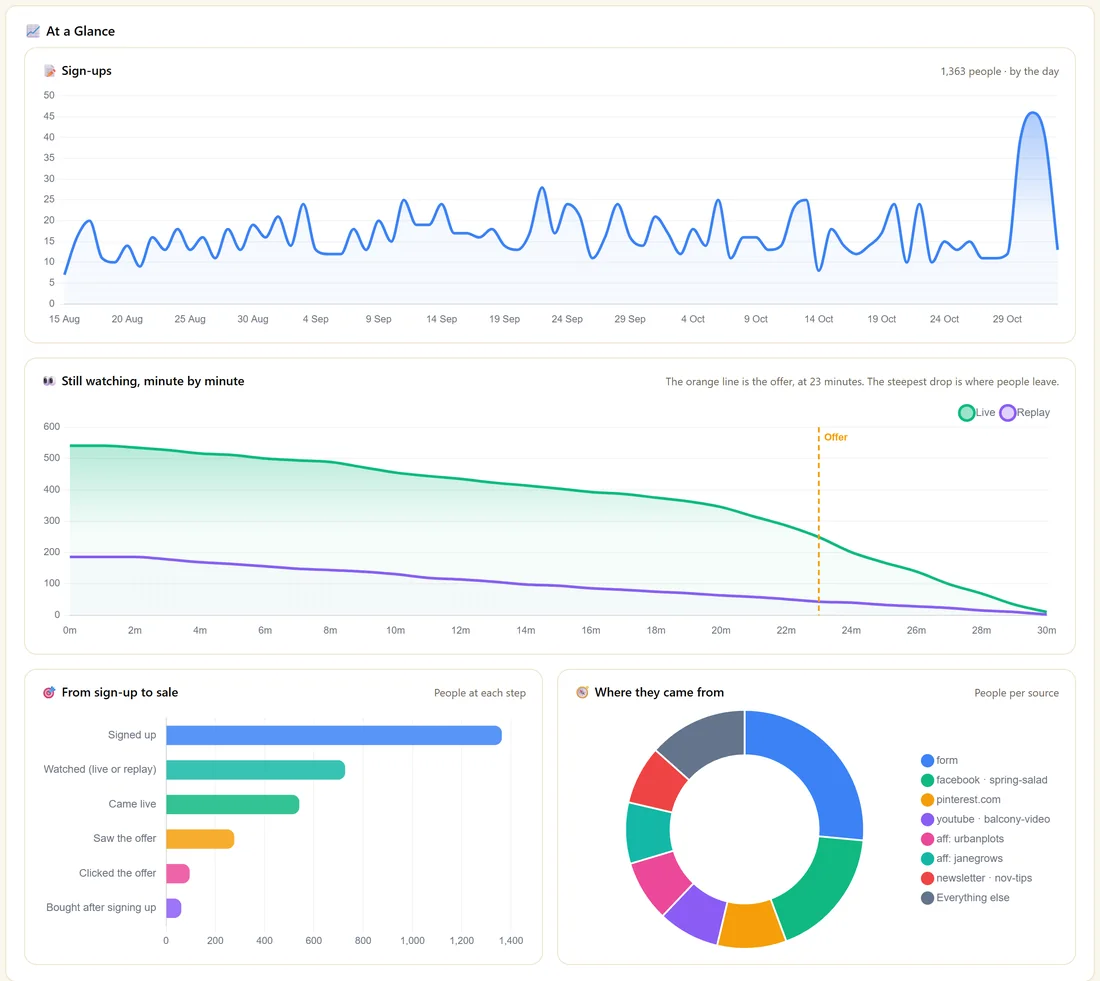
- Sign-ups, by the day
- Still watching, minute by minute, live and replay, with an orange line at the offer. The steepest drop is where people leave.
- From sign-up to sale, people at each step
- Where they came from, people per source
People:
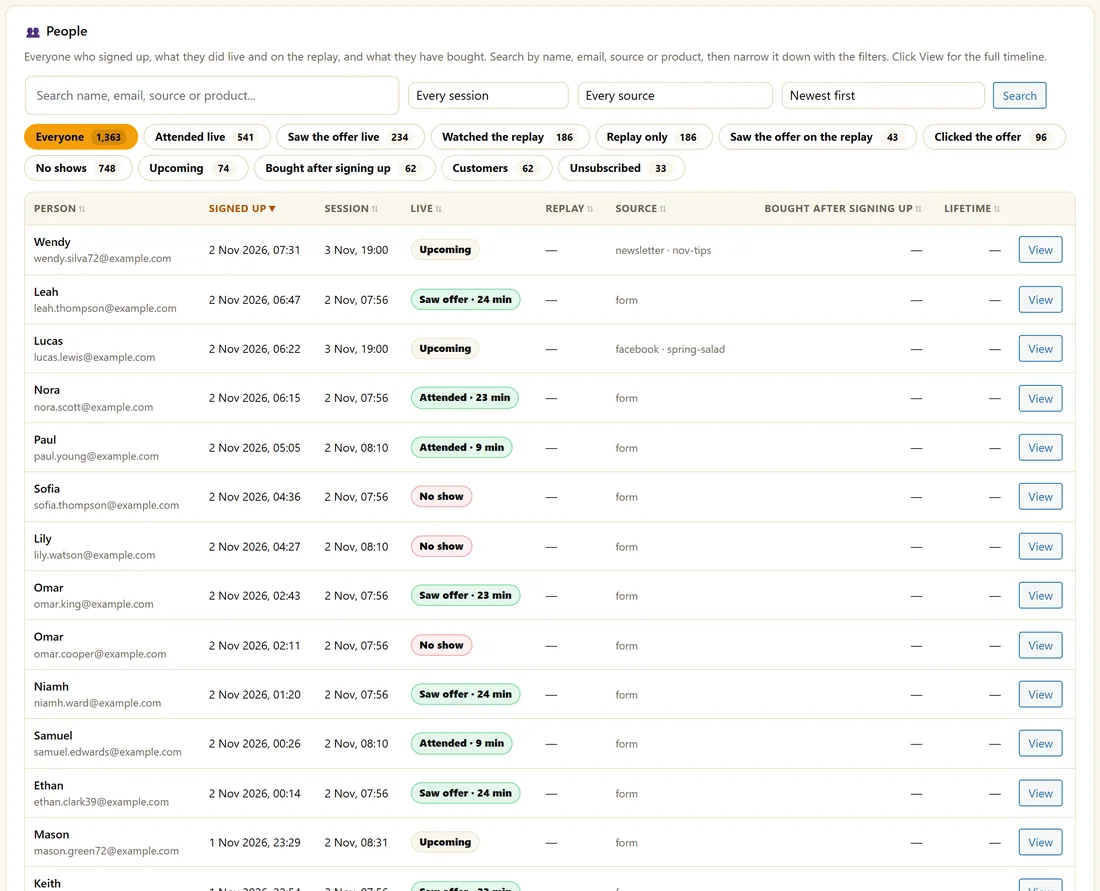
Everyone who signed up, what they did live and on the replay, and what they bought. Search by name, email, source or product, filter by session and source, sort, and use the chips: Everyone, Attended live, Saw the offer live, Watched the replay, Replay only, Saw the offer on the replay, Clicked the offer, No shows, Upcoming, Bought after signing up, Customers and Unsubscribed. Click View for a person's full timeline.
Export:

Click Download CSV for one row per person: email, first name, first signed up, sign-ups, latest session, live and minutes watched, replay and minutes watched, clicked offer, emails, status, traffic source, affiliate, campaign and full tracking. With sales recorded, it adds what they bought and lifetime revenue.
A real example:
Maya's Kitchen Garden Plan shows a 40 percent show-up rate, about 20 minutes average watched of 30, and 68 percent of attendees still there at the offer. The minute by minute chart drops at minute 9, so she shortens that part of her script.
Using it well:
Show-up rate is lifted by reminders and good session times. Clicks are lifted by the content before the offer, which the minute by minute chart points to.
The 1.2.104 numbers in plain words:
- Show-up rate counts people who signed up before the show ended, so replay-only sign-ups do not lower it.
- Per live attendee tells you what each person who came live was worth in sales.
- Per replay viewer tells you the same for the replay, so you can see if the replay earns its keep.
- Replay minutes count the furthest point reached in the video, so a tab left open does not make the replay look better than it is.
- Suspect sign-ups are left out of the rates, so a burst from one source does not distort them.
Using the minute by minute chart:
- Look for the steepest drop in the live line.
- Note the minute.
- Open the Content tab and find what plays at that minute.
- Shorten it, add a poll, or move a story there.
- Compare the chart a week later.
Using the People list:
- Clicked the offer and not bought: people to follow up with personally
- Replay only: people who prefer the replay, worth a shorter replay email
- Upcoming: people booked for sessions still to come
The person timeline:
View shows every step for one person: sign-ups, live and replay viewing with minutes, offer clicks, emails and purchases.
Picking a session:
Use the session filter on the People list to look at one airing, for example the week you changed your offer.
What to do next:
- The Dashboard: Your Webinars At A Glance
- Timed Offers And Click Tracking
Common questions:
Why is the show-up rate different on the Dashboard?
The Dashboard covers the period you pick across all webinars. The Analytics tab covers one webinar's whole history.
Can I open the CSV in a spreadsheet?
Yes. It opens in any spreadsheet app, one row per person.