The Dashboard is the first tab, and the first thing you see is how your bridges are doing. Everything on it is drawn inside your own WordPress admin from your own Activity Log, with no outside chart service.
The four stat cards:

- Active Bridges: bridges that are enabled.
- Connected: apps connected as a source or destination.
- Total Syncs: every entry in the Activity Log, apart from contacts still queued.
- Failed: entries with the Failed status. The card turns red when it is above zero.
Choosing a range:
The buttons above the Analytics block are Today, Yesterday, 7d, 14d, 30d, 90d, All time and Custom. Custom opens a From and To date box with an Apply button. Your choice is remembered for you the next time you open the Dashboard. Very long ranges, such as All time on a long history, are drawn week by week.
The trend cards:
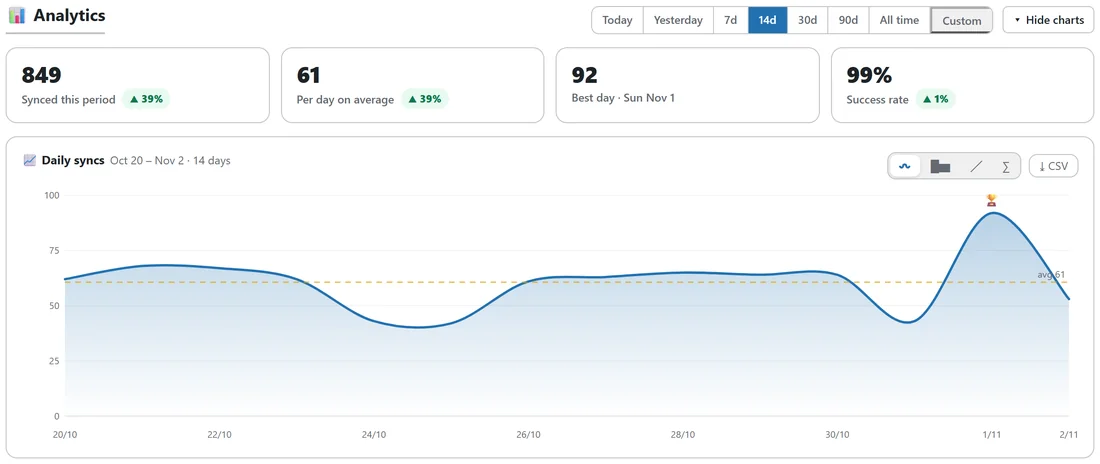
- Synced this period: how many contacts moved. For All time it reads Synced all time.
- Per day on average. For Today or Yesterday it becomes Per hour on average.
- Best day, with its date. On a weekly view it is Best week, and on a single day the Busiest hour.
- Success rate.
Each card is compared with the period of the same length just before it, with a green up or red down arrow and the change in percent. New activity after a quiet period shows new.
The daily chart:
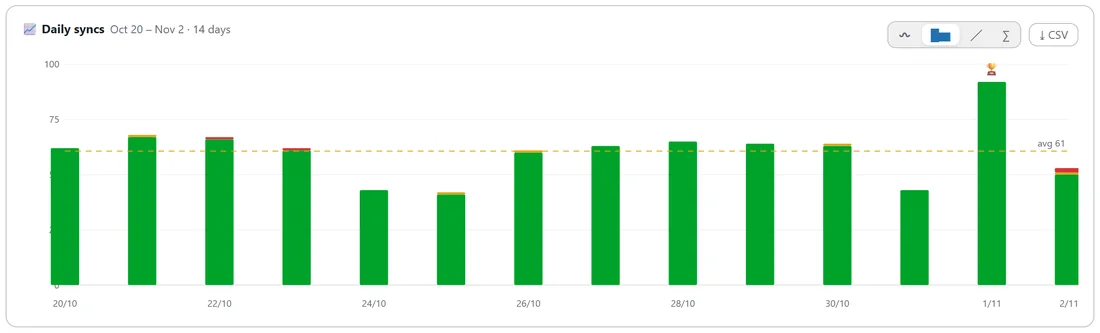
The chart shows the range day by day, with a dashed average line and a small trophy on the busiest point. Four buttons in its top right corner change the style:
- Smooth area, the default.
- Stacked bars, splitting each day into success, partial and failed.
- Clean line with a dot on each day.
- Running total.
Hover anywhere on the chart for the exact numbers for that day. The CSV button downloads the range as a spreadsheet file with total, success, partial, failed and running total for each day.
The three rings:

- Sync health: the share of syncs that succeeded, partly succeeded or failed, with the success rate in the middle.
- Destination share: where your contacts are going, with the top app's share in the middle.
- Bridge share: which bridge does the most work.
Each ring lists its top five, with the rest grouped as Other.
Most active bridges and top destinations:
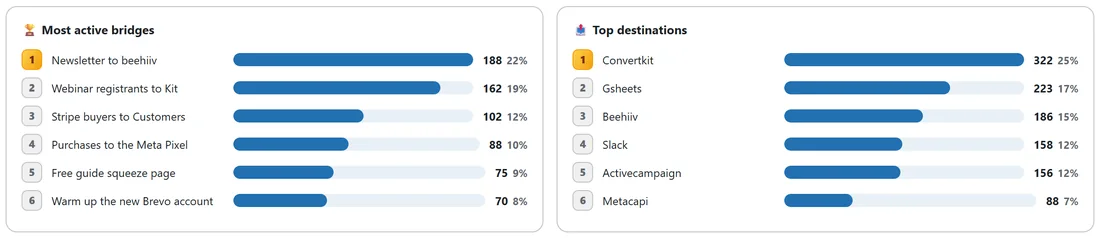
Two ranked lists show the six busiest bridges and the six apps that received the most, each with a bar, a count and a percentage.
Below the charts:
- Connected Integrations: a green chip for every connected app.
- Active Bridges: your first five bridges with their status and counts, and View all bridges.
- Recent Activity: the ten newest log rows, and View full log.
Showing and hiding:
Hide charts folds the Analytics block away and remembers your choice. Show charts brings it back.
How queued contacts are counted:
A contact waiting on a delay or a drip is counted once, when it is delivered, not when it joins the queue.
A real example:
Over fourteen days, yoursite.com synced 849 contacts, 39 percent more than the fourteen days before. The best day was Sunday 1 November with 92. Destination share shows Kit and Google Sheets taking the most, and Newsletter to beehiiv tops Most active bridges.
When there is nothing to show yet:
On a new site the Analytics block says your sync charts will appear as your bridges run.
Reading the trend cards well:
A big rise in Synced this period after a launch is normal. Keep an eye on the Success rate instead. If it dips, open the Activity Log filtered by Partial to see which destination needs attention.
Tips:
- Use 7d to spot a quiet bridge quickly.
- Download the CSV at the end of each month to keep a simple record.