The Diagnostics tab exists so that a support conversation can start with facts instead of guesses. It is also the quickest way to check the health of a site yourself.
The support report:
At the top of the Debug Log and Support Report section are three buttons.
- Copy Report for Support puts the whole report on your clipboard, ready to paste into a ticket.
- Download .txt saves the same report as a file.
- Open Support opens the support page.
The report holds versions, connections, bridges with each one's delay, drip and queue, recent errors and the technical debug log. Keys and passwords are removed before anything goes into it.
The debug log:
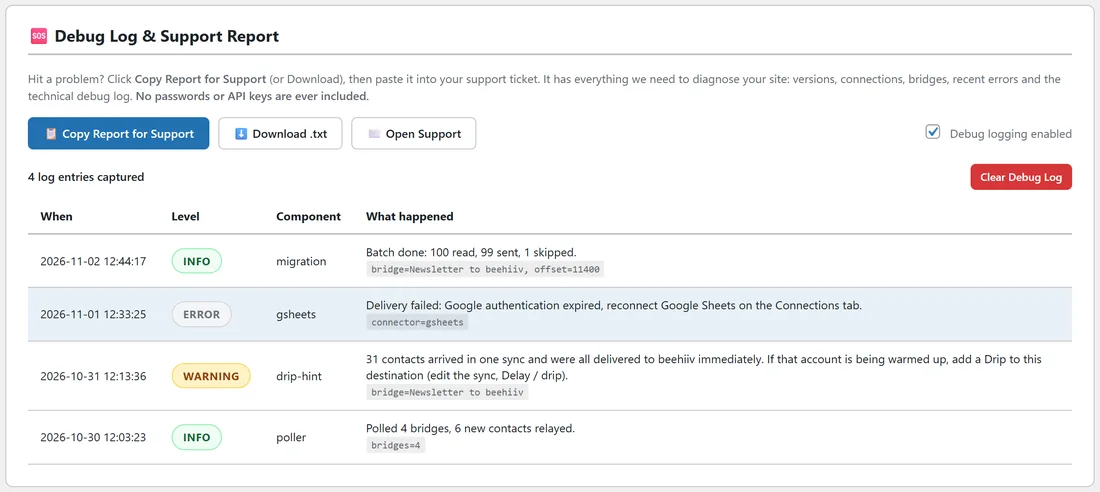
Below the buttons is a table of captured entries, newest first.
- When: the date and time.
- Level: INFO, WARNING or ERROR.
- Component: the part of the plugin or the app involved, such as poller, gsheets or migration.
- What happened: a plain description, with any extra detail underneath.
When a sync fails, the technical detail lands here by itself. The section also shows how many entries are captured and a Clear Debug Log button. When nothing is wrong, it shows a green note saying no errors are logged.
Debug logging switch:
Debug logging enabled, on the right of the buttons, turns the debug log on or off. It is on by default. Leave it on unless support asks otherwise.
System panel:
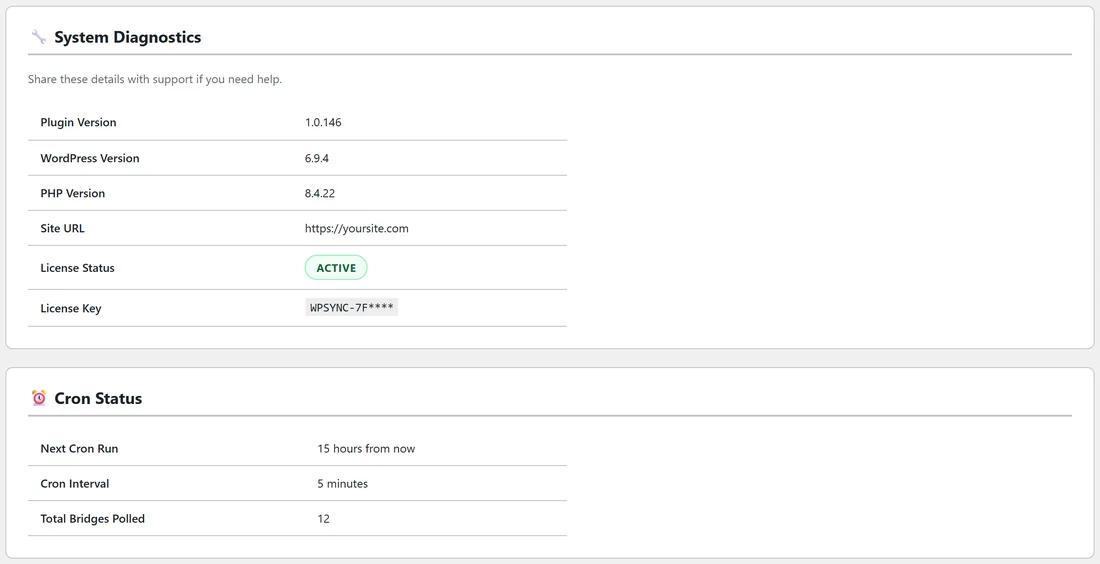
System Diagnostics lists Plugin Version, WordPress Version, PHP Version, Site URL, License Status and the first characters of the License Key.
Cron Status panel:
- Next Cron Run: when the next five minute check is due. Not scheduled means the check is not running, which on its own explains a polled source that never fires.
- Cron Interval: 5 minutes.
- Total Bridges Polled: how many bridges the check is keeping track of.
Connections panels:
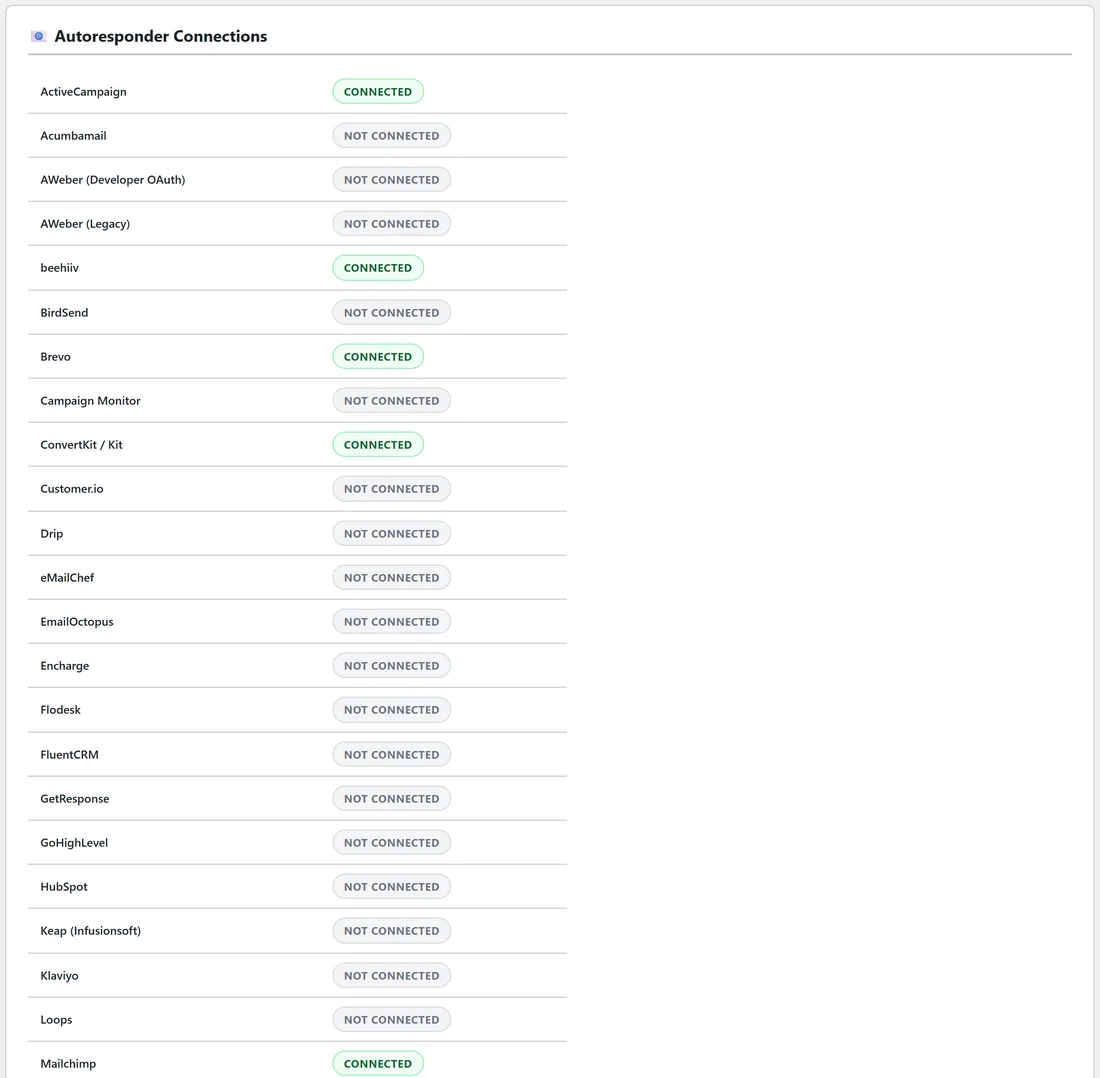
Autoresponder Connections lists every built in app with Connected or Not Connected. Connector Add-ons does the same for every pack connector. This is the fastest way to spot a connection that has lost its credentials.
Environment panel:
Server Software, SSL, Memory Limit, Max Execution, Total Log Entries, and Connector Catalog, a one line summary of how many connections core and each pack provide and which packs are active.
A real example:
yoursite.com's debug log showed an ERROR from gsheets: Delivery failed: Google authentication expired, reconnect Google Sheets on the Connections tab. The owner opened Connections, clicked Edit Settings on Google Sheets Connect, pasted the service account key again and clicked Save Changes. The next sale appended its row as normal.
When to use it:
- Before opening a support ticket. Copy the report and paste it in.
- Any time a bridge behaves differently on one site than another.
Opening a support ticket that gets answered fast:
- Open Diagnostics and click Copy Report for Support.
- Write one line about what you expected and what happened, with the bridge name.
- Paste the report under it.
- Add the email of one affected contact, if there is one.
With the report, support can see versions, connections and the exact error without asking.
What the levels mean:
- INFO: a normal event worth recording, such as a migration batch.
- WARNING: something to look at, such as a drip suggestion.
- ERROR: something did not work, with the app's own message.
Tips:
- Clear the debug log after fixing something, so new entries stand out.
- Check Cron Status first when only polled bridges are quiet.