The Activity Log tab lists every action WP Sync has taken, newest first, 25 entries to a page. Each row is one contact passing through one bridge, with the result from every destination on it.
Where to find it:
Open WP Sync and click the Activity Log tab. The total number of entries shows at the top right, next to the Clear Log button.
The columns:
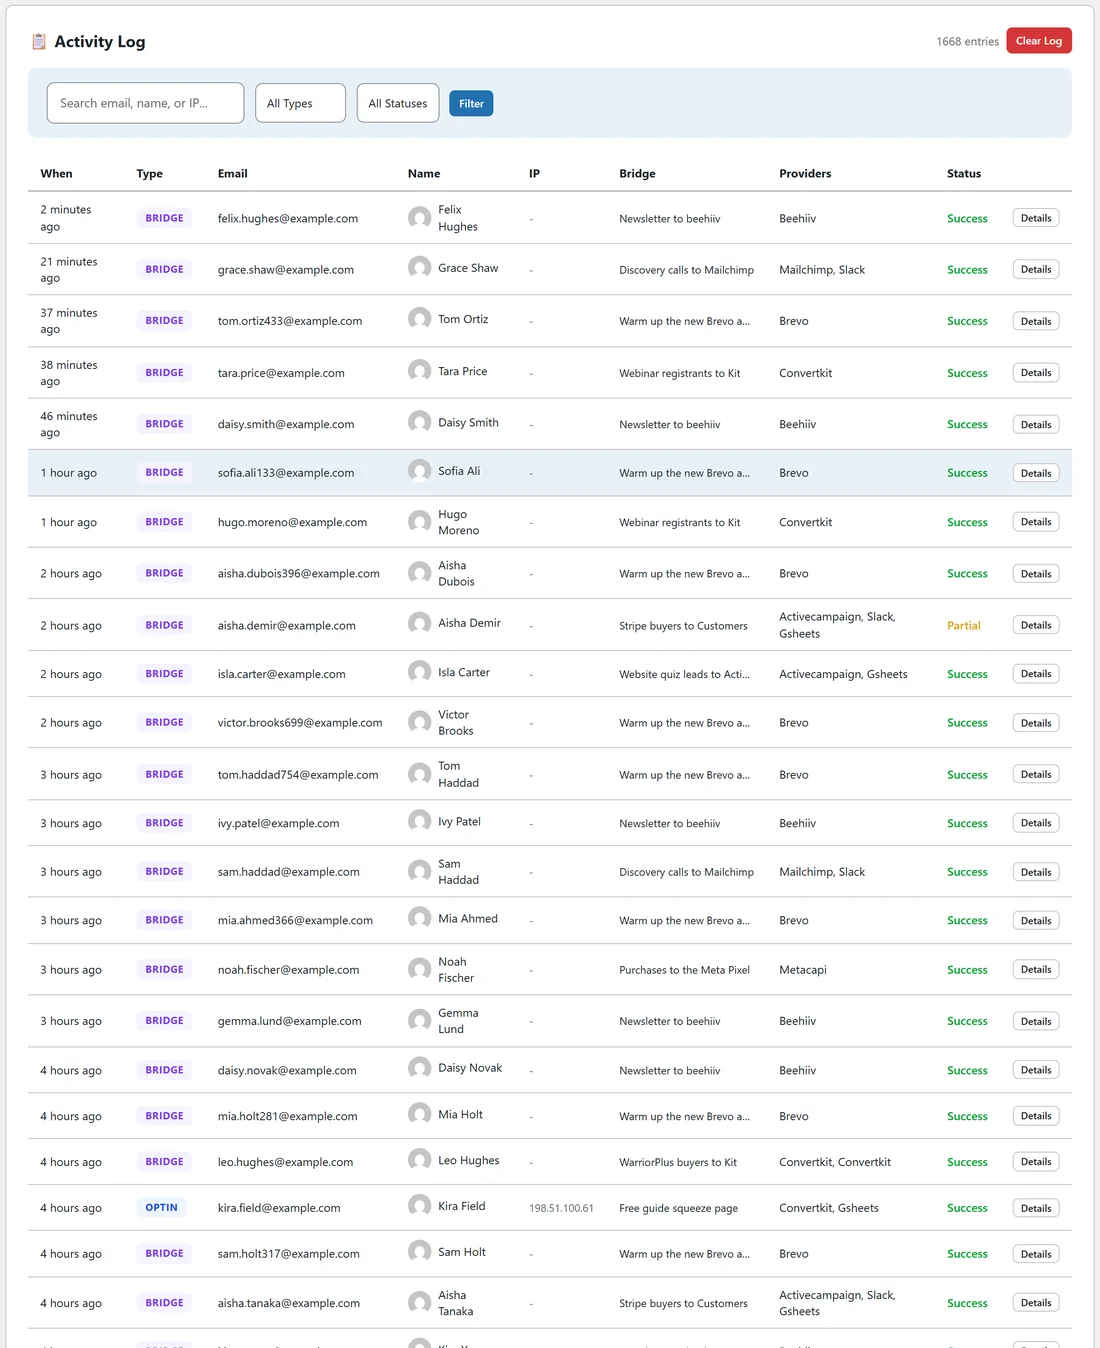
- When: how long ago, with the exact time when you hover.
- Type: BRIDGE or OPTIN.
- Email.
- Name, with a small avatar.
- IP: filled for opt ins that came from a visitor's browser.
- Bridge: the bridge name.
- Providers: the destination apps it went to.
- Status.
- A Details button.
The two types:
- Bridge. The contact came from a source app through a bridge, polled or pushed.
- Optin. The contact came in through the opt in form endpoint, for example a squeeze page form. See Squeeze Page And Form Opt Ins.
The statuses:
- Success. Every destination accepted the contact, or the contact was skipped by a filter as intended.
- Partial. At least one destination accepted and at least one did not, or a step is waiting for an email address.
- Failed. The run could not happen at all, for example a source could not be read during the five minute check, or a form arrived with no email.
- Queued. A delayed or dripped destination is waiting. When it delivers, a Success row is written.
Searching and filtering:
The grey bar above the table holds three controls and a Filter button.
- Type an email, a name or an IP address in the search box.
- Pick a type: All Types, Optin (form) or Bridge (cron).
- Pick a status: All Statuses, Success, Partial or Failed.
- Click Filter. Click Clear to go back to everything.
This is how you answer the most common question of all: did this one person ever sync?
The Details panel:
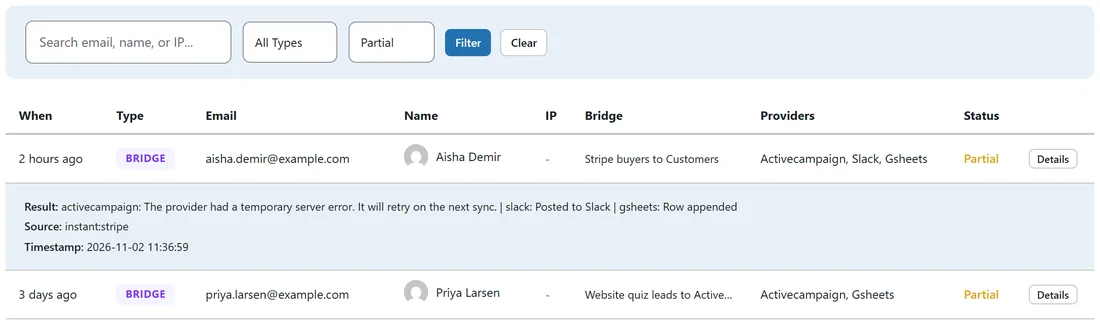
Click Details on any row to open it under the row. It shows the following.
- Result: what each destination said, separated by bars, such as activecampaign: Added | slack: Posted to Slack | gsheets: Row appended.
- Source: how the contact arrived, such as instant:stripe or form.
- Referer and UA: the page and browser of a form opt in, where captured.
- Timestamp: the exact time.
Click Details again to close it.
What else gets logged:
- Contacts stopped by a filter, with Skipped by filter and the condition that stopped them.
- Live tests, marked LIVE TEST (manual).
- A big Migrate run records only problems, not a row for every contact, so the log stays readable.
A real example:
A customer of yoursite.com, Aisha Demir, asked why she had no welcome email. The owner typed aisha.demir in the search box and clicked Filter. Her row was Partial, and Details showed activecampaign: The provider had a temporary server error, while Slack and the sheet were fine. The owner sent her through again with Send live test, and she was on the list within a minute.
Clearing the log:
Clear Log on this tab, and Clear Activity Log in the Settings Danger Zone, empty the log after you confirm. It cannot be brought back, so read or note anything you need first.
Privacy:
The log stores the contact details that moved through your bridges, on your own site. Treat it as personal data under whichever privacy rules apply to you.
Paging through:
At the foot of the table, Prev and Next move a page at a time, and page numbers jump straight to a page. The total in the top right shows how many entries match your current filters.
Questions the log answers:
- Did this person sync? Search their email.
- Is this bridge failing? Filter by Partial and look at the Bridge column.
- Where do opt ins come from? Filter by Optin (form) and open Details for the Referer.
The status colours:
Success is green, Partial is amber and Failed is red, in the Status column and in the Dashboard charts alike, so you can scan a page in a second.
Tips:
- For one bridge only, History on the Bridges tab is faster.
- The Dashboard charts are drawn from this same log, so a clean log means clean charts.