The Dashboard is the first thing you see when you open ResultsAiX ADs. It shows what your ads brought in, kept apart from everything that did not come from an ad, with the change against the period before.
Where to find it:
Open ResultsAiX ADs, or click Dashboard in the menu. Full results opens the Results screen and New campaign starts a campaign.
Autopilot:
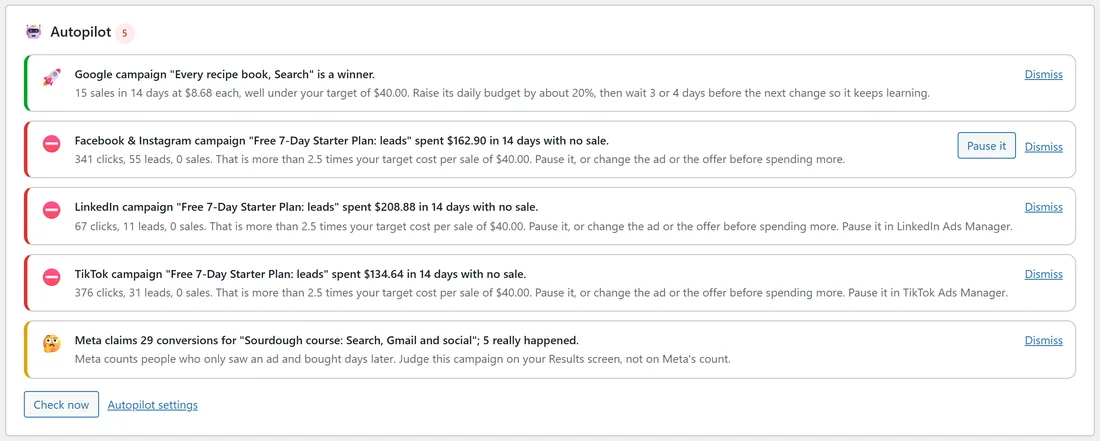
When Autopilot has found something, its card sits at the top: campaigns worth more budget, campaigns spending with no sale, tracking that stopped, and big gaps between what a network claims and what really happened. Check now runs it again. See Autopilot: What To Pause, What To Scale.
The date range:
7 days, 30 days, 90 days, 12 months, or Custom dates. The line next to it sums up the period, for example "198 leads and 72 sales from ads in the last 30 days, compared with the period before".
The stat cards:

- Ad clicks: people who came from an ad.
- Leads from ads, with the cost per lead.
- Sales from ads, with the cost per sale.
- Revenue from ads: the money your ad sales brought in.
- Ad spend, as Google, Meta and the other networks report it.
- Return on ad spend: revenue for every 1 spent.
- Not from ads: leads and sales kept separate.
Each card shows its change against the period before, green when it went up and red when spend went up.
Your ads, day by day:
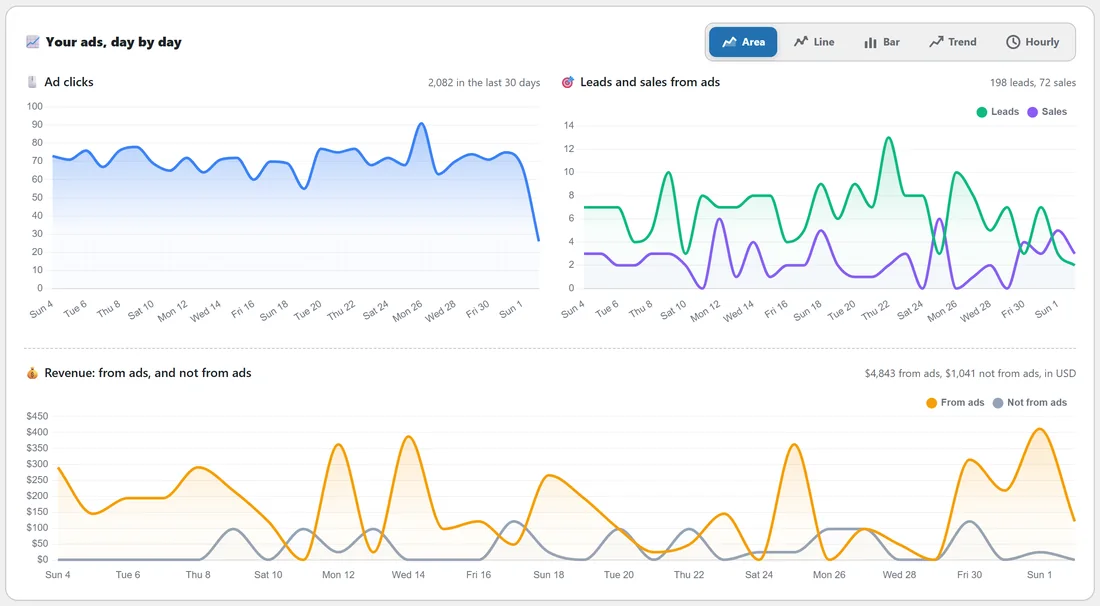
Three charts: Ad clicks; Leads and sales from ads; and Revenue: from ads, and not from ads. Switch the style with Area, Line, Bar, Trend or Hourly.
From click to sale, By network, Not from ads:
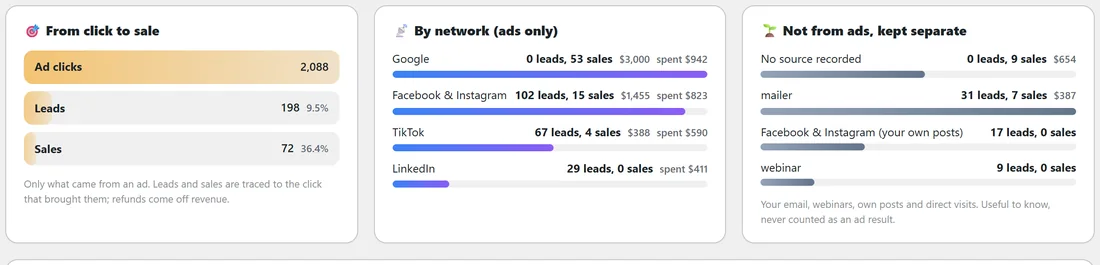
- From click to sale: ad clicks, then leads (with the share of clicks), then sales (with the share of leads).
- By network (ads only): leads, sales, revenue and spend for each network.
- Not from ads, kept separate: your email, webinars, own posts and direct visits. Useful to know, never counted as an ad result.
Your campaigns:
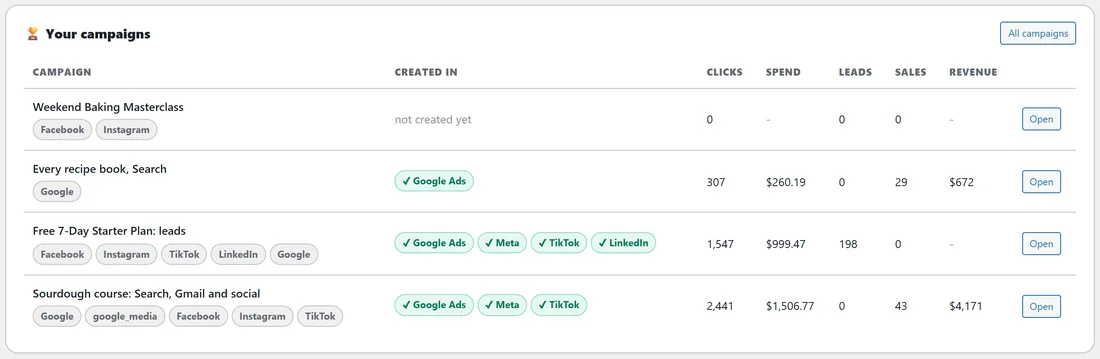
Each campaign with the networks it was created in (Google Ads, Meta, TikTok, LinkedIn and so on), clicks, spend, leads, sales and revenue across every network, and Open.
What I found on your site:
Every ResultsAiX plugin and store ADs reads, with how many records, what ADs does with it, whether it is in use, and one button that puts it to work (for example Send active subscribers to Google, or Ask what converts). See Working With The Rest Of The ResultsAiX Family.
Connections, AI engines, Licence and health:
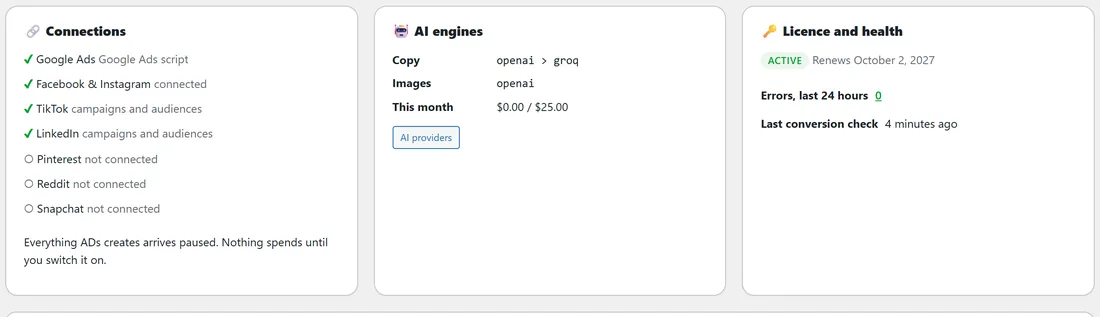
- Connections: each network, connected or not.
- AI engines: your writing and picture providers and this month's AI spend against your budget.
- Licence and health: your licence, errors in the last 24 hours, and when leads and sales were last checked.
Money is charted in your main currency; other currencies are shown beside it, never added together. The numbers refresh every five minutes.
A real example:
For the last 30 days, the Dashboard of yoursite.com shows 2,088 ad clicks, 198 leads and 72 sales from ads, $4,843 revenue from ads, $2,766 ad spend and a 1.75x return. By network, Google brings most of the sales and Facebook and Instagram most of the leads. Not from ads shows the newsletter's own sales on a separate line.
Tips:
- Use 7 days for a quick check, 30 days for decisions.
- Click Full results for every network, campaign, keyword and landing page. See Results: Which Ad Made Which Sale.