The 📊 Dashboard is the overview of every tracking link on your site. Stat cards, charts and the latest activity all follow the same date range, so you always compare like with like.
Where To Find It:
Click 📊 Dashboard, the first item in the menu bar. It is also the page that opens when you click WPC Tracker in the WordPress menu.
Choosing The Date Range:

The 📅 Dashboard Range buttons are Today, Yesterday, 7 Days, 30 Days, This Year, Lifetime and Custom. Custom shows a From and To date pair with an Apply button. Every card, chart and table redraws together. The Dashboard opens on Today.
Choosing A Chart Style:
The 📊 Visualization Style buttons switch the trend charts between five views:
- Area: filled curves, the easiest way to read volume over a longer range.
- Line: thin lines, better for spotting small day to day changes.
- Bar: one bar per day, clearest when you compare a handful of days.
- Sales Trend: a stepped line instead of a smooth curve.
- Hourly: activity by hour of the day, which is the view the Dashboard opens with.
Each chart shows its current mode in the corner, for example Area Chart or Hourly Breakdown.
The Stat Cards:

- Total Clicks: every click on every link in the range.
- Unique Clicks: clicks from different IP addresses.
- Total Links: how many tracking links you have.
- Gross Revenue: what customers paid, with refunds taken off.
- Net Earnings: what you kept after fees and affiliate commissions, with refunds taken off.
- Avg Order Value: Gross Revenue divided by paid sales. Free leads are not counted.
- EPC: earnings per click.
- Refunds: sales fully refunded in the range.
- Refund Rate: refunds as a share of all sales.
- Conversions: leads and sales together.
- Countries: how many different countries your clicks came from.
With Pro Tools installed, three more cards appear: Total Cost, Profit / Loss and ROI. See Cost Per Click And Profit Tracking With Pro Tools.
The Charts:
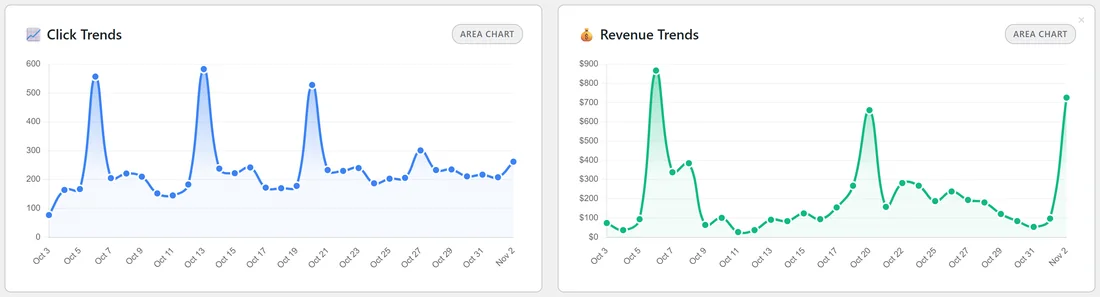
- 📈 Click Trends and 💰 Revenue Trends: clicks and revenue over the range.
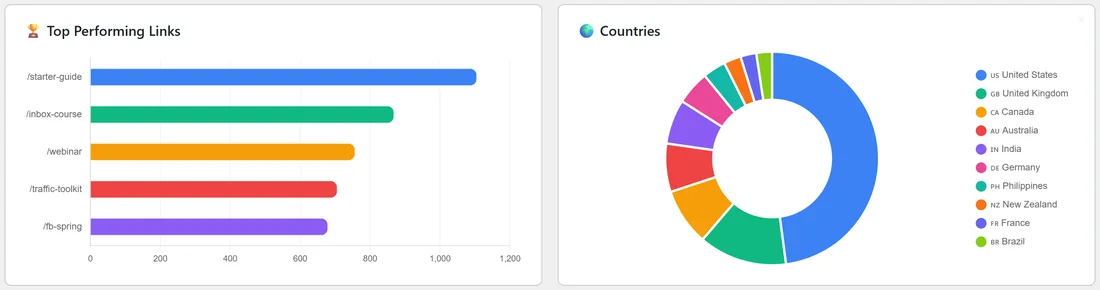
- 🏆 Top Performing Links: your busiest links.
- 🌍 Countries: where your clicks come from.
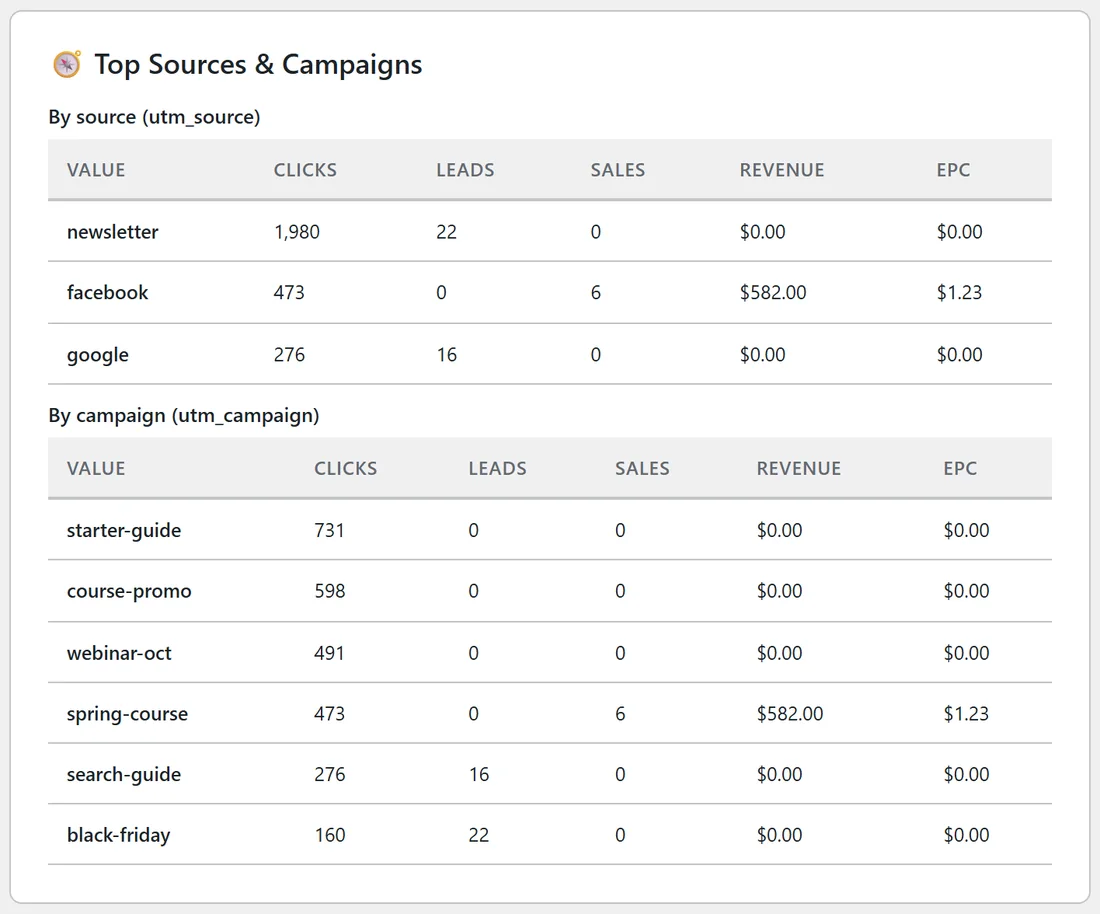
- 🧭 Top Sources & Campaigns: clicks, leads, sales, revenue and EPC by utm_source and by utm_campaign. See UTM Tags And Custom Parameters.
- 📋 Top Converting Links (Leads) and 💰 Top Converting Links (Sales).
- 🏷️ Your Top Performing Offers (Vendor) and 🤝 Top Performing Affiliate Offers, for marketplace sales.
- 💰 Cost vs Revenue & Profit / Loss, with Pro Tools.
Recent Activity:
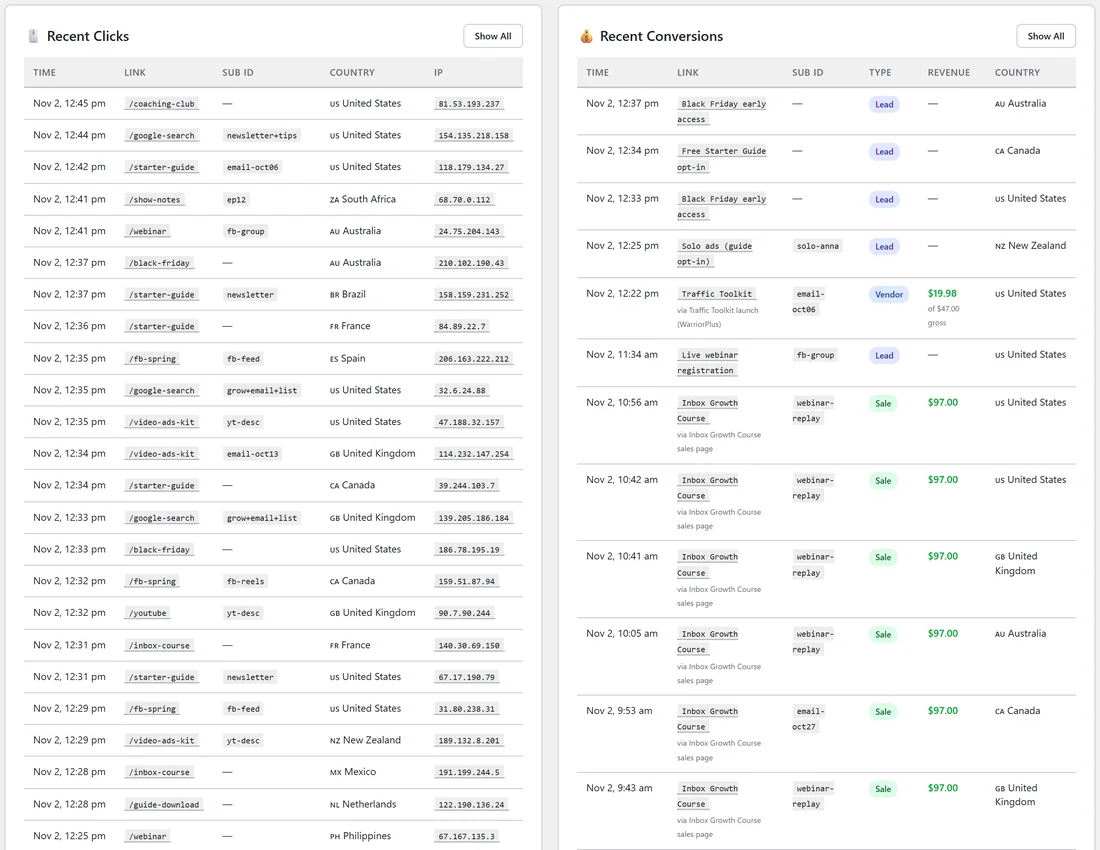
At the bottom, 🖱️ Recent Clicks lists the latest clicks with Time, Link, Sub ID, Country and IP, and 💰 Recent Conversions lists the latest leads and sales with Time, Link, Sub ID, Type, Revenue and Country. Show All on each opens the full IP Activity Log or the Conversions list.
Hiding What You Do Not Need:
Every card and chart has a small × in its corner. Click it to hide that item. A Hidden items menu then appears with a count. Open it to restore items one at a time, or click Show all items. The choice is saved for your own WordPress user, so colleagues keep their own view.
A Real Example:
The owner of yoursite.com checks the Dashboard every Monday on 30 Days with the Area style. Click Trends shows clear spikes on the four Tuesday newsletter days. Top Sources & Campaigns shows the newsletter bringing the most clicks, and facebook the only source with paid course sales, at $1.23 EPC. The Profit / Loss card stays well above zero after the paid ads costs, so the ads keep running.
Reading It Day To Day:
- Start on 7 Days with Area to see whether volume is holding steady.
- Switch to 30 Days to judge a whole campaign rather than one email.
- Use Custom to match a launch window or a billing period.
- When a number surprises you, open that link's 📊 Stats page from 🔗 All Links. The detail usually explains it. See Per-Link Stats And Printable Reports.
Tips:
- Hide cards you never use so the ones you check are at the top.
- The Dashboard counts every link together. For one link, use its Stats page. For a group of links, use 📁 Folders.