An automation can run for months, and the question is always the same: which email is doing the work, and which one is losing people? The automation report answers it email by email, and shows where everyone is in the flow right now.
Where to find it:
Emails, then Automations, then 📊 Report on the automation's row. Inside the editor, the 📊 Report button above the canvas opens the same screen, and ✏️ Edit this automation takes you back.
The top of the report:
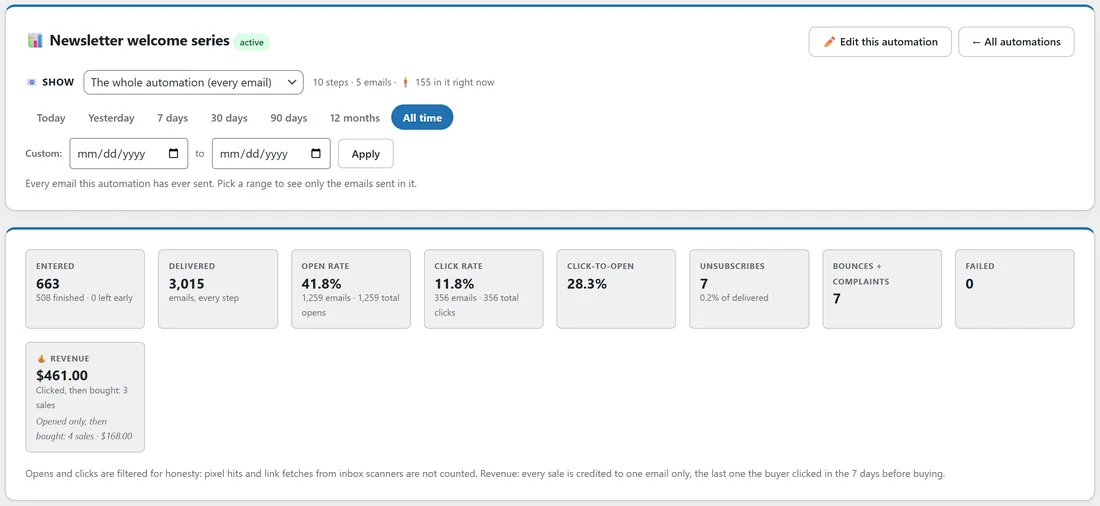
- The name and status of the automation.
- 📧 Show: a picker set to "The whole automation (every email)". Choose one email instead and every number, tab and chart on the page is for that email only. Clicking an email's name anywhere in the report does the same.
- A line with how many steps and emails the flow has and how many people are in it right now.
- The date pills: Today, Yesterday, 7 days, 30 days, 90 days, 12 months and All time, plus Custom dates with Apply. The report opens on All time. A range shows the emails sent in that period and everything those emails went on to do; it drives the tiles, the charts, the top links and the email table.
The tiles:
- Entered, with how many finished and how many left early.
- Delivered: emails sent.
- Open rate and Click rate, with the number of emails opened or clicked and the total opens or clicks.
- Click-to-open.
- Unsubscribes, as a share of delivered.
- Bounces + complaints, and Failed.
- 💰 Revenue, once the Mailer has sales on record. Every sale is credited to one email only, the last one the buyer clicked in the 7 days before buying. Buyers who opened but never clicked are shown on their own "Opened only, then bought" line.
Opens and clicks are filtered: pixel hits and link checks from inbox scanners are not counted. If some emails did not go out, a box under the tiles groups them by what the sending service said.
The people tabs:
📊 Overview, 👀 Who opened, 🖱️ Who clicked, 🛒 Who purchased, 😴 Didn't open, 👋 Unsubscribed, 💰 Revenue, 📱 Devices, 🌍 Countries and 📮 Inbox providers. The people tabs list the actual people, and you can tag them for a follow-up. They always cover everyone the automation has reached, so their counts can be larger than the tiles when a range is picked.
Charts and top links:
The 📬 Opens and 🖱️ Clicks charts can be shown as Area, Line, Bar, Trend or Hourly. 🔗 Top links lists the most clicked links with clicks and people.
Every email in this automation:
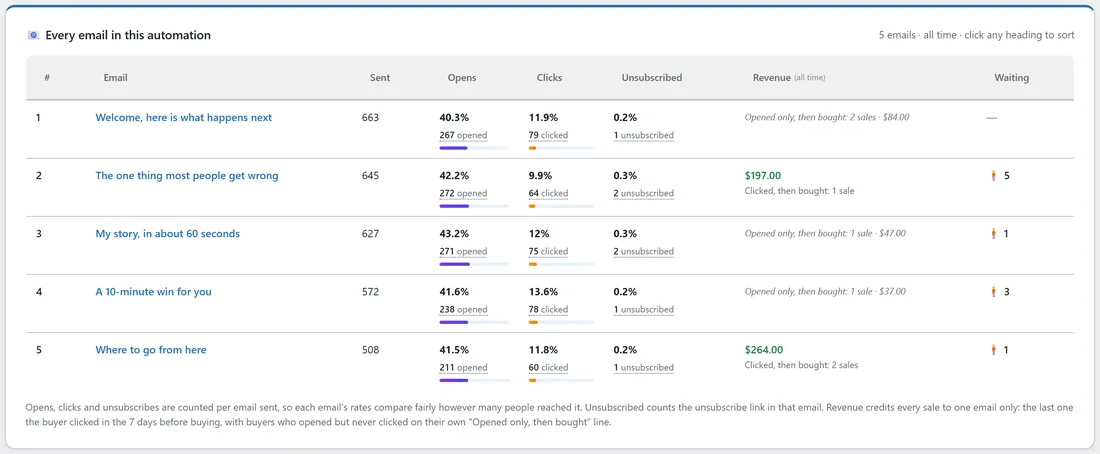
One row per email, numbered in the order the automation runs, with a YES or NO label when an email sits on a branch. For each email:
- Sent
- Opens: the open rate and how many opened
- Clicks: the click rate and how many clicked
- Unsubscribed: people who used the unsubscribe link in that email, so the rows add up
- Revenue (all time): sales credited to that email
- Waiting: people waiting to receive it right now
Click any heading to sort. Click a count, such as "64 clicked", to see exactly who.
Step by step:
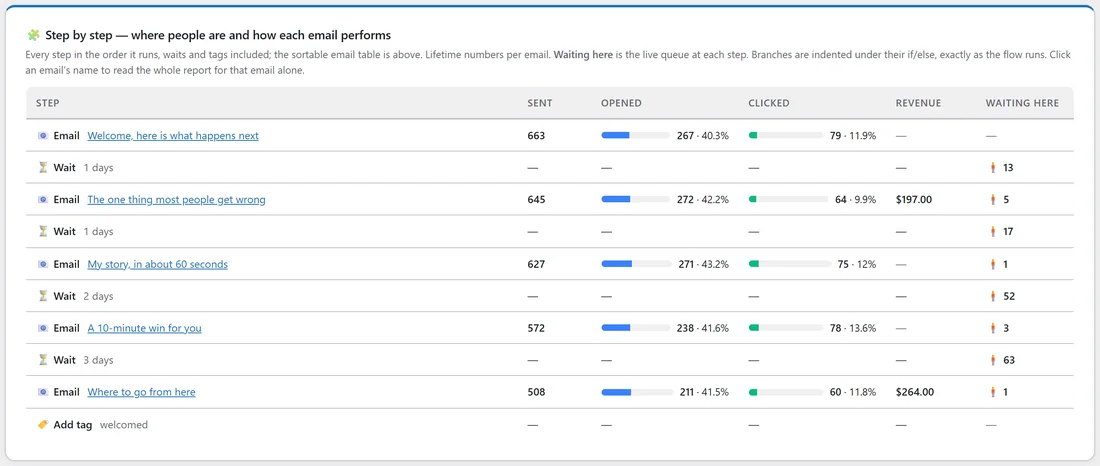
The last table lists every step in the order it runs, waits and tags included, with branches indented under their if/else. Email rows show sent, opened, clicked and revenue; every row shows how many are waiting there. Under it, 🚪 Why people left early lists each exit reason with a count and a bar.
A real example:
The report for "Newsletter welcome series" on Leafwise Gardening shows 663 entered, 508 finished and 0 left early. Opens hold steady around 41% across all five emails. "The one thing most people get wrong" has the lowest click rate (9.9%) but earned the first click sale, and "Where to go from here" earned two. Anna sorts by Clicks, rewrites the opening of the weakest email, and checks the 30 days pill a month later to compare.
Tips:
- Look for the email where opens hold up but clicks drop, or where unsubscribes jump. Rewrite that one first.
- How revenue is counted is explained in How Email Revenue Is Counted.
- People who left early, and why, are covered in Taking People Out Of An Automation.