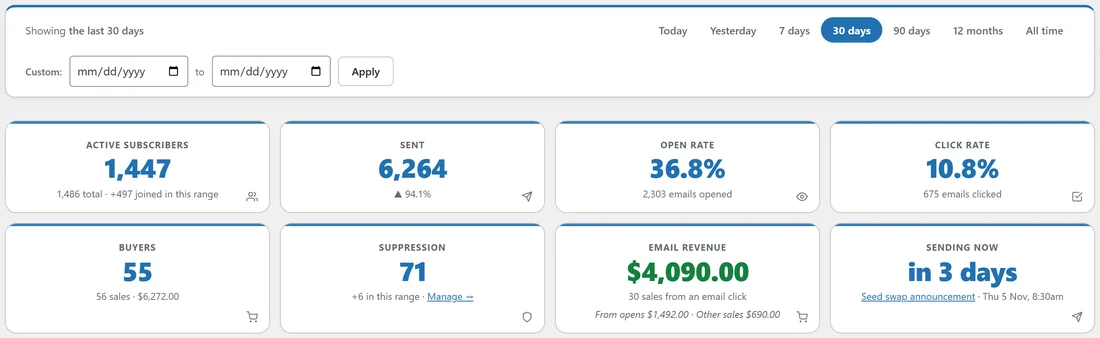
The Dashboard is the first screen you see when you open the Mailer. It answers the questions you ask every morning: how big is my list, what went out, who opened and clicked, what did email earn, and what is sending right now.
One date range drives the whole page, so every tile, chart and table on it is counted over the same window.
Where to find it:
Click AiX Mailer in the WordPress sidebar, or click Dashboard at the left of the blue menu bar on any Mailer screen.
Choosing the date range:
The range bar at the top says what you are looking at, for example Showing the last 30 days.
- Click a range pill: Today, Yesterday, 7 days, 30 days, 90 days, 12 months or All time.
- Or pick two dates in the Custom boxes and click Apply.
- The whole Dashboard reloads for that window.
The Mailer remembers your choice, so the next time you open the Dashboard it shows the range you picked last. Reports uses the same pills and the same counting, so 30 days means the same thing on both screens.
The eight tiles:
- Active Subscribers: people who can be mailed right now. Underneath is the total on file and how many joined in this range, with a small trend line.
- Sent: emails sent in the range, broadcasts and automations together. The arrow compares it with the period before.
- Open Rate: the share of sent emails that were opened, with the number of emails opened underneath.
- Click Rate: the share of sent emails that were clicked, with the number of emails clicked. Clicks on unsubscribe and view in browser links are not counted.
- Buyers: people who bought in the range, with the number of sales and the money taken. It appears once a sales source is connected. Hover over it to see the figures by source.
- Suppression: everyone who unsubscribed, bounced or complained, all time, with how many were added in this range. Manage opens the suppression manager.
- Email Revenue: sales from people who clicked one of your emails in the 7 days before they bought. The line underneath shows From opens and Other sales, so the three figures add up to everything that came in. See How Email Revenue Is Counted.
- Sending Now: what the queue is doing at this moment. It shows the broadcast being sent and how many emails are queued, or the next scheduled broadcast and when it goes, or Idle with a Schedule one link.
The charts:
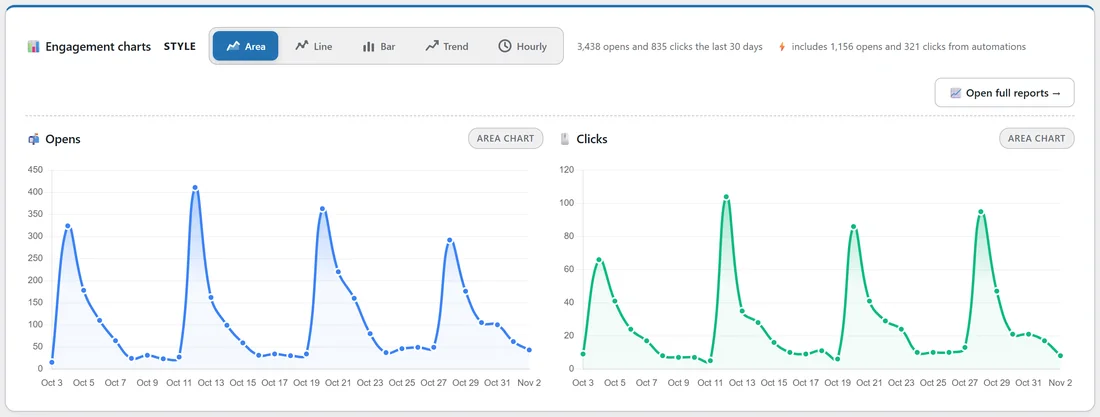
Under the tiles, the Engagement charts show Opens and Clicks for the range, one point per hour, day, week or month depending on how long the range is.
- Style switches the look: Area, Line, Bar, Trend or Hourly. Hourly shows which hours of the day your readers open and click.
- The note beside the styles says how many opens and clicks happened, and how many of them came from automations. Both charts always count every email, broadcasts and automations together.
- Open full reports takes you to Reports with the same range.
Automations running:
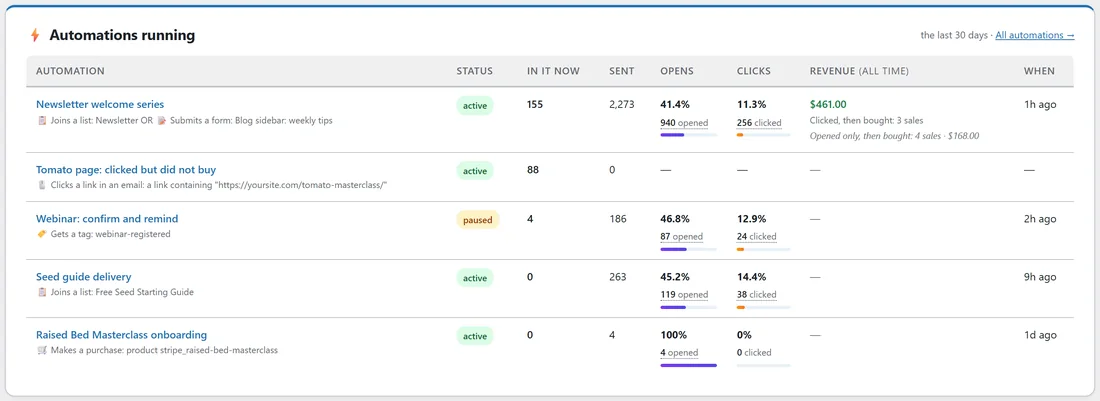
This table lists up to five automations that are switched on or have people part way through them, busiest first.
- Status: active or paused.
- In it now: people part way through it at this moment.
- Sent, Opens and Clicks: what it sent in the range. Opens and Clicks show the rate, the number of people, and a small bar. Click the number of people to see exactly who.
- Revenue (all time): sales credited to that automation since it started.
- When: how long ago it last sent.
Click an automation's name to open its report, or All automations to see the full list.
Quick actions and recent broadcasts:
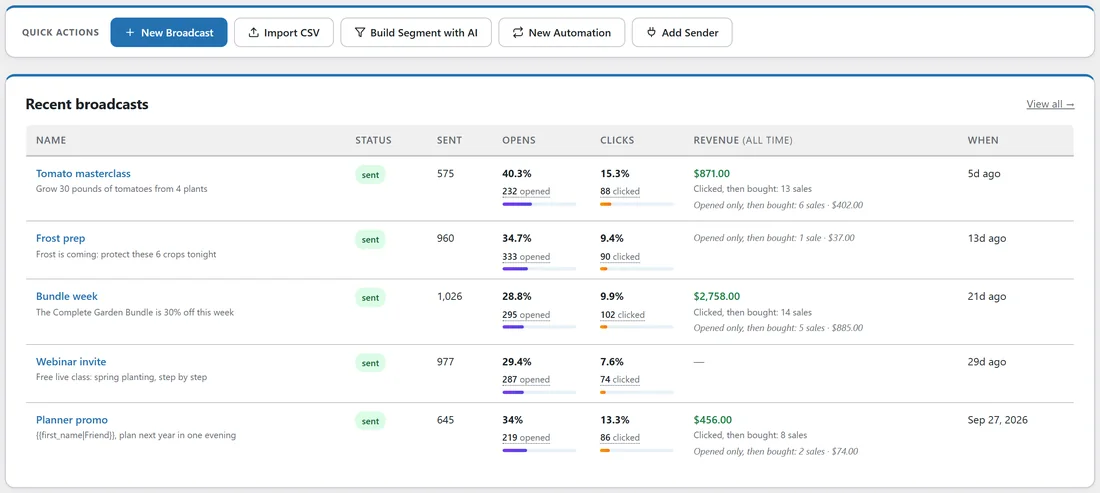
Quick actions are shortcuts: New Broadcast, Import CSV, Build Segment with AI, New Automation and Add Sender.
Recent broadcasts lists the last five broadcasts that went out, with the same Sent, Opens, Clicks, Revenue (all time) and When columns. Click a name to open that broadcast's report. Drafts and scheduled broadcasts are not listed here; they wait on the Broadcasts tab.
The activity cards:
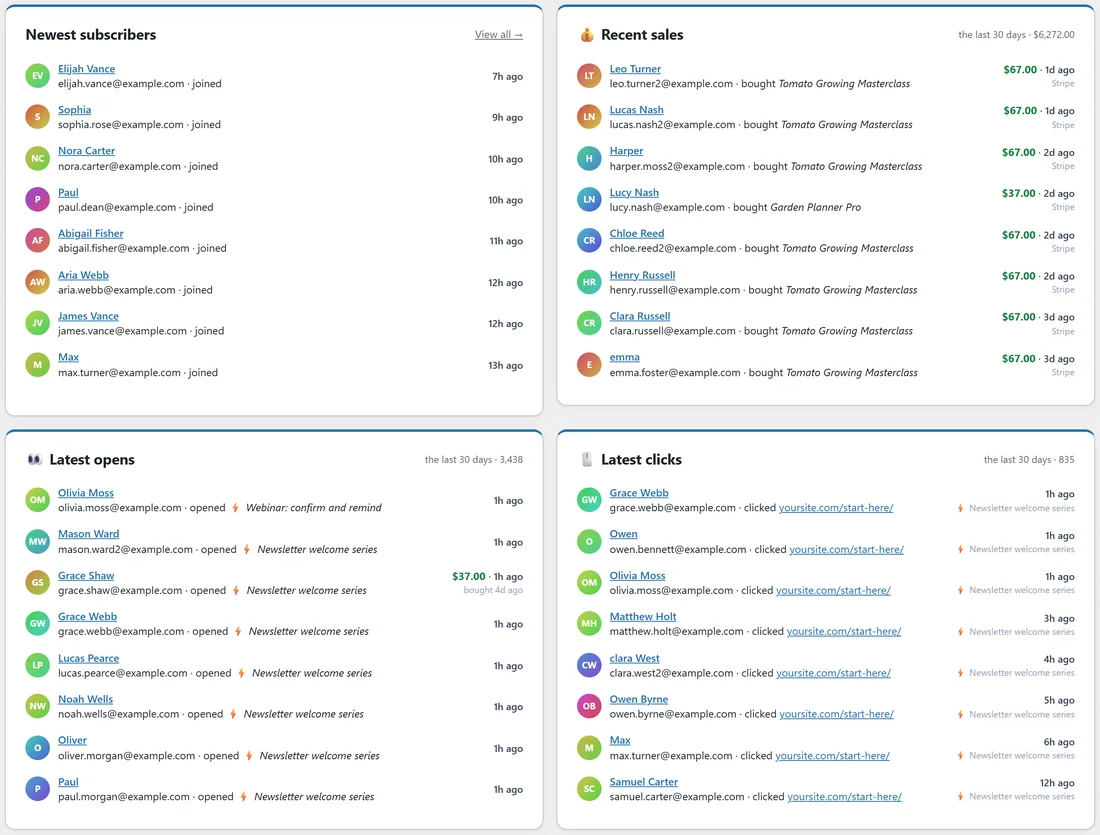
- Newest subscribers: the eight latest sign-ups, with what they have spent if they are buyers.
- Recent sales: the latest sales in the range, with the product, the amount and where it came from, plus a small sales chart. It appears once a sales source is connected.
- Latest opens: who opened, and which email. A small lightning mark means the email came from an automation.
- Latest clicks: who clicked, the link they clicked, and which email it was in.
Click any person's name to open their profile without leaving the Dashboard.
Hiding what you do not need:
Every tile, chart and card has a small x in its corner. Click it to hide that item. A Hidden items button then appears near the top of the page with a count. Click it and choose an item to bring it back, or Show all items to restore everything. What you hide is remembered for your own WordPress user only, so other admins still see the full Dashboard.
A real example:
Anna at Leafwise Gardening opens the Dashboard on a Monday and clicks 30 days. She sees 1,447 active subscribers with 497 joined in the range, a 36.8% open rate and a 10.8% click rate. The Email Revenue tile shows the money from people who clicked her emails, and From opens and Other sales underneath.
Sending Now says her Seed swap announcement goes out in 3 days. In Automations running she sees 155 people part way through the Newsletter welcome series. In Recent broadcasts, Bundle week has earned the most, so she clicks it to see who bought.
Tips:
- Use 7 days for a quick weekly check and 30 days for trends.
- Hide tiles you never look at so the ones you care about fill the row.
- For deeper numbers on the same range, click Open full reports. See List Health: Unsubscribes, Bounces And Complaints and Tracking Opens, Clicks And Unsubscribes.
- If Sending Now says Idle when you expected a send, check the broadcast is scheduled, then see Diagnostics And Fixing Problems.