The stats cards show how one funnel is doing, right where you change its settings. Use them to decide which funnels to promote, which to improve and which to switch off.
Where to find them:
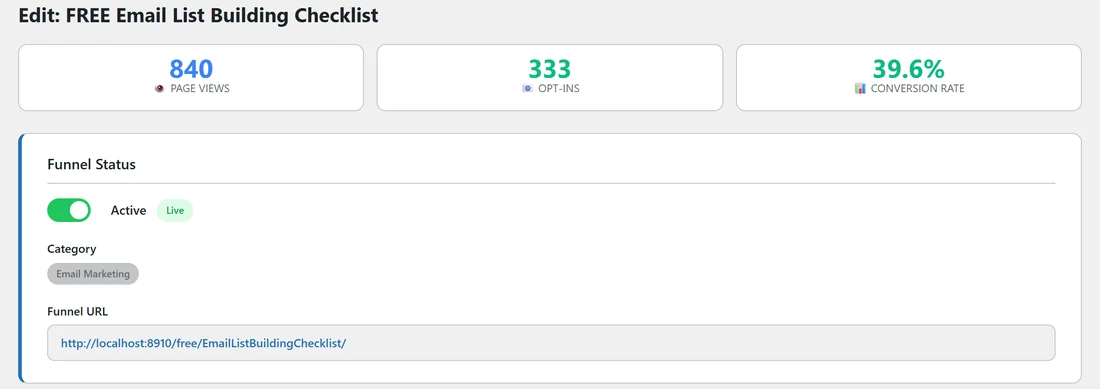
Open the Funnels tab and click Edit on any funnel. The three cards sit at the top of the page, under the title.
The three cards:

- Page Views: how many times real visitors opened this funnel's squeeze page, all time.
- Opt-ins: how many times real visitors reached this funnel's download page, which happens after they opt in.
- Conversion Rate: opt-ins divided by page views, as a percentage.
The Conversion Rate number is coloured to help you read it at a glance: green at 20% and above, amber from 10% to under 20%, and red under 10%.
What is counted:
The cards use the same numbers as the Dashboard. Bots and logged-in administrators are left out, so your own previews do not change them.
Using the cards:
- Open the Edit page of a funnel you are promoting.
- Note the Page Views and Conversion Rate.
- Change one thing, for example the Custom Headline or the Background Color.
- Promote the funnel as usual for a week or two.
- Come back and compare the Conversion Rate.
A real example:
The cards for FREE Email List Building Checklist show 840 page views, 333 opt-ins and a green 39.6%. Sam keeps the funnel as it is and sends it more traffic. Another funnel shows a low rate, so Sam tries a clearer Custom Headline on its Edit page and checks the card again two weeks later.
Tips:
- Give a funnel at least 100 page views before judging its Conversion Rate.
- Compare funnels side by side on the Dashboard's Top Performing Funnels table and on the Lists tab.
- For the number of email addresses received, see the Lists tab and Collected Emails.